Immigrants from Singapore vs Immigrants from Pakistan Births to Unmarried Women
COMPARE
Immigrants from Singapore
Immigrants from Pakistan
Births to Unmarried Women
Births to Unmarried Women Comparison
Immigrants from Singapore
Immigrants from Pakistan
25.6%
BIRTHS TO UNMARRIED WOMEN
100.0/ 100
METRIC RATING
15th/ 347
METRIC RANK
27.2%
BIRTHS TO UNMARRIED WOMEN
99.8/ 100
METRIC RATING
34th/ 347
METRIC RANK
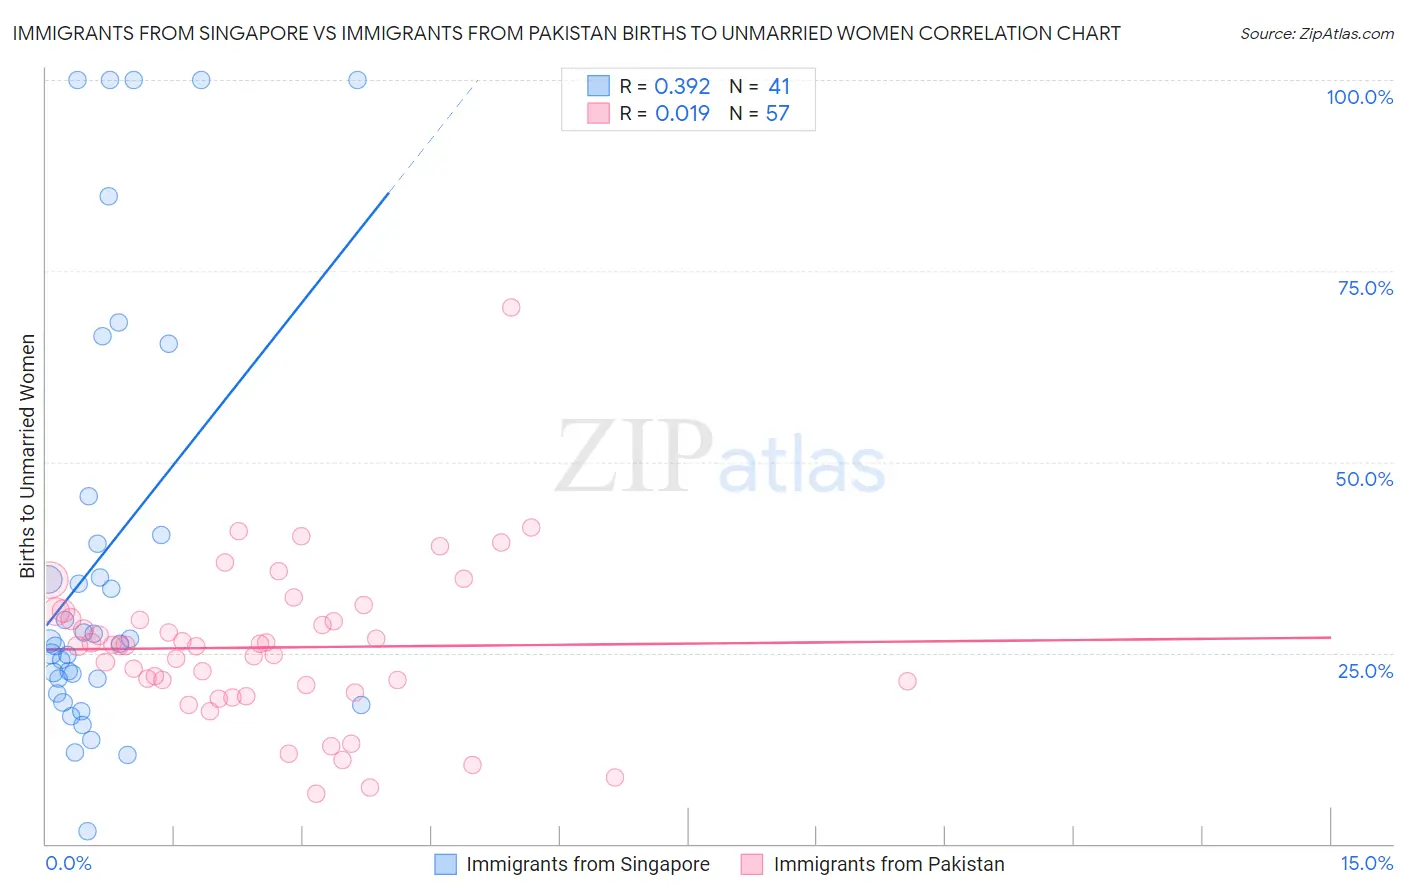
Immigrants from Singapore vs Immigrants from Pakistan Births to Unmarried Women Correlation Chart
The statistical analysis conducted on geographies consisting of 131,320,191 people shows a mild positive correlation between the proportion of Immigrants from Singapore and percentage of births to unmarried women in the United States with a correlation coefficient (R) of 0.392 and weighted average of 25.6%. Similarly, the statistical analysis conducted on geographies consisting of 268,631,463 people shows no correlation between the proportion of Immigrants from Pakistan and percentage of births to unmarried women in the United States with a correlation coefficient (R) of 0.019 and weighted average of 27.2%, a difference of 6.0%.
Births to Unmarried Women Correlation Summary
| Measurement | Immigrants from Singapore | Immigrants from Pakistan |
| Minimum | 1.7% | 6.6% |
| Maximum | 100.0% | 70.2% |
| Range | 98.3% | 63.6% |
| Mean | 38.2% | 25.7% |
| Median | 26.5% | 26.0% |
| Interquartile 25% (IQ1) | 20.6% | 20.3% |
| Interquartile 75% (IQ3) | 43.0% | 29.9% |
| Interquartile Range (IQR) | 22.4% | 9.6% |
| Standard Deviation (Sample) | 28.5% | 10.3% |
| Standard Deviation (Population) | 28.1% | 10.3% |
Demographics Similar to Immigrants from Singapore and Immigrants from Pakistan by Births to Unmarried Women
In terms of births to unmarried women, the demographic groups most similar to Immigrants from Singapore are Immigrants from Belarus (25.6%, a difference of 0.050%), Immigrants from Uzbekistan (25.8%, a difference of 0.62%), Immigrants from Lebanon (25.3%, a difference of 1.2%), Immigrants from Armenia (26.1%, a difference of 1.7%), and Armenian (26.2%, a difference of 2.3%). Similarly, the demographic groups most similar to Immigrants from Pakistan are Immigrants from Sri Lanka (27.2%, a difference of 0.040%), Immigrants from Russia (27.1%, a difference of 0.11%), Immigrants from Iraq (27.1%, a difference of 0.14%), Bulgarian (27.1%, a difference of 0.43%), and Cypriot (27.0%, a difference of 0.59%).
| Demographics | Rating | Rank | Births to Unmarried Women |
| Immigrants | Lebanon | 100.0 /100 | #14 | Exceptional 25.3% |
| Immigrants | Singapore | 100.0 /100 | #15 | Exceptional 25.6% |
| Immigrants | Belarus | 100.0 /100 | #16 | Exceptional 25.6% |
| Immigrants | Uzbekistan | 100.0 /100 | #17 | Exceptional 25.8% |
| Immigrants | Armenia | 99.9 /100 | #18 | Exceptional 26.1% |
| Armenians | 99.9 /100 | #19 | Exceptional 26.2% |
| Immigrants | Korea | 99.9 /100 | #20 | Exceptional 26.3% |
| Soviet Union | 99.9 /100 | #21 | Exceptional 26.3% |
| Burmese | 99.9 /100 | #22 | Exceptional 26.4% |
| Immigrants | Japan | 99.9 /100 | #23 | Exceptional 26.4% |
| Immigrants | Australia | 99.9 /100 | #24 | Exceptional 26.6% |
| Cambodians | 99.9 /100 | #25 | Exceptional 26.7% |
| Asians | 99.9 /100 | #26 | Exceptional 26.8% |
| Immigrants | Asia | 99.9 /100 | #27 | Exceptional 26.8% |
| Okinawans | 99.8 /100 | #28 | Exceptional 26.9% |
| Cypriots | 99.8 /100 | #29 | Exceptional 27.0% |
| Bulgarians | 99.8 /100 | #30 | Exceptional 27.1% |
| Immigrants | Iraq | 99.8 /100 | #31 | Exceptional 27.1% |
| Immigrants | Russia | 99.8 /100 | #32 | Exceptional 27.1% |
| Immigrants | Sri Lanka | 99.8 /100 | #33 | Exceptional 27.2% |
| Immigrants | Pakistan | 99.8 /100 | #34 | Exceptional 27.2% |