Jamaican vs Immigrants from Canada Births to Unmarried Women
COMPARE
Jamaican
Immigrants from Canada
Births to Unmarried Women
Births to Unmarried Women Comparison
Jamaicans
Immigrants from Canada
38.5%
BIRTHS TO UNMARRIED WOMEN
0.0/ 100
METRIC RATING
298th/ 347
METRIC RANK
30.4%
BIRTHS TO UNMARRIED WOMEN
83.7/ 100
METRIC RATING
139th/ 347
METRIC RANK
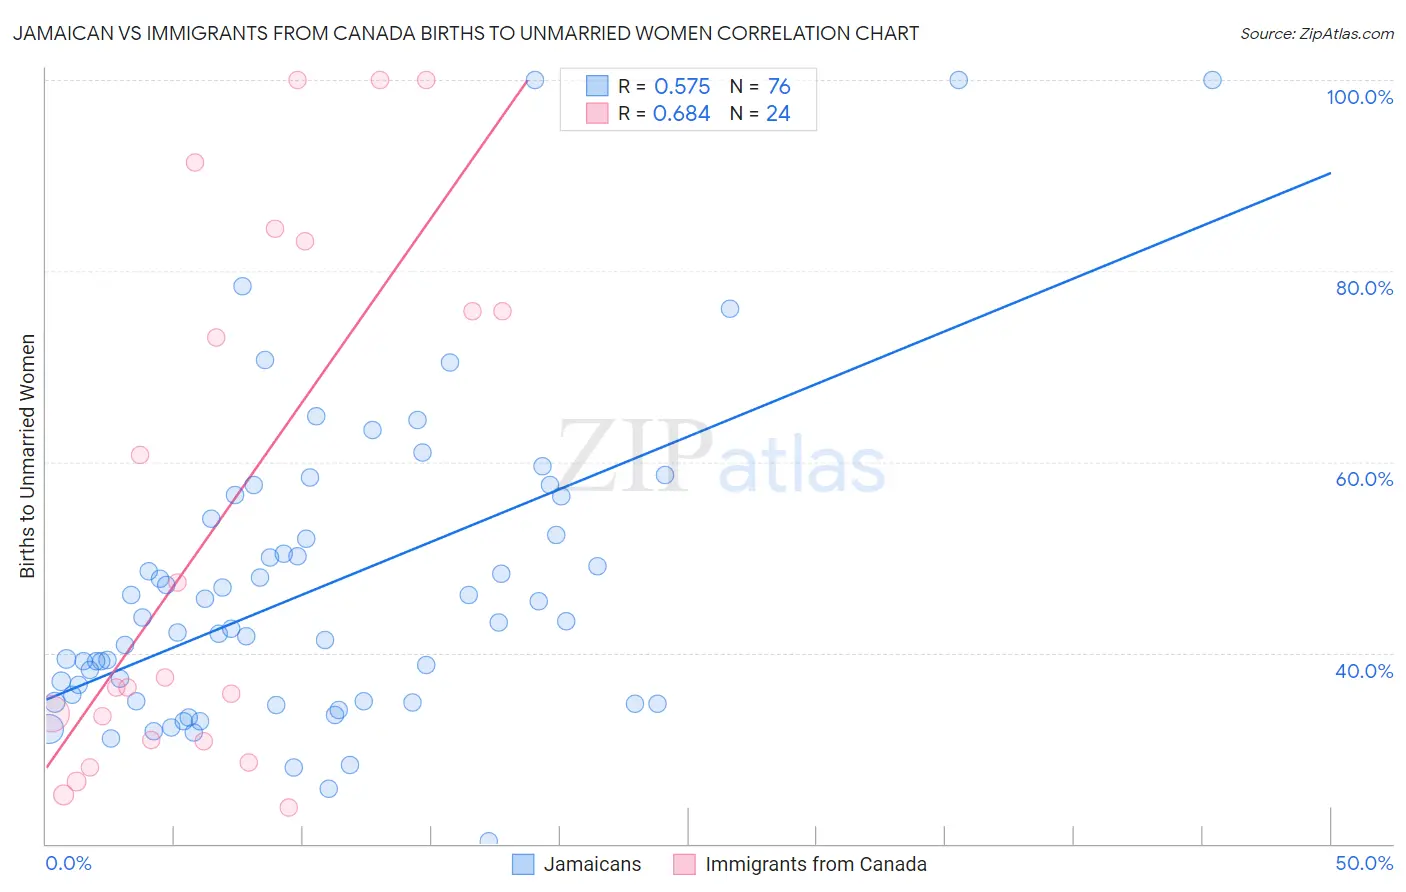
Jamaican vs Immigrants from Canada Births to Unmarried Women Correlation Chart
The statistical analysis conducted on geographies consisting of 347,671,371 people shows a substantial positive correlation between the proportion of Jamaicans and percentage of births to unmarried women in the United States with a correlation coefficient (R) of 0.575 and weighted average of 38.5%. Similarly, the statistical analysis conducted on geographies consisting of 419,760,568 people shows a significant positive correlation between the proportion of Immigrants from Canada and percentage of births to unmarried women in the United States with a correlation coefficient (R) of 0.684 and weighted average of 30.4%, a difference of 26.4%.
Births to Unmarried Women Correlation Summary
| Measurement | Jamaican | Immigrants from Canada |
| Minimum | 20.2% | 23.8% |
| Maximum | 100.0% | 100.0% |
| Range | 79.8% | 76.2% |
| Mean | 46.7% | 54.1% |
| Median | 42.9% | 36.9% |
| Interquartile 25% (IQ1) | 34.9% | 30.8% |
| Interquartile 75% (IQ3) | 53.2% | 79.4% |
| Interquartile Range (IQR) | 18.3% | 48.7% |
| Standard Deviation (Sample) | 16.1% | 27.9% |
| Standard Deviation (Population) | 16.0% | 27.3% |
Similar Demographics by Births to Unmarried Women
Demographics Similar to Jamaicans by Births to Unmarried Women
In terms of births to unmarried women, the demographic groups most similar to Jamaicans are Dutch West Indian (38.4%, a difference of 0.20%), Spanish American (38.6%, a difference of 0.20%), Immigrants from West Indies (38.6%, a difference of 0.26%), Haitian (38.6%, a difference of 0.27%), and Alaska Native (38.3%, a difference of 0.48%).
| Demographics | Rating | Rank | Births to Unmarried Women |
| Seminole | 0.0 /100 | #291 | Tragic 37.9% |
| Blackfeet | 0.0 /100 | #292 | Tragic 37.9% |
| Immigrants | Nicaragua | 0.0 /100 | #293 | Tragic 38.0% |
| British West Indians | 0.0 /100 | #294 | Tragic 38.0% |
| Iroquois | 0.0 /100 | #295 | Tragic 38.2% |
| Alaska Natives | 0.0 /100 | #296 | Tragic 38.3% |
| Dutch West Indians | 0.0 /100 | #297 | Tragic 38.4% |
| Jamaicans | 0.0 /100 | #298 | Tragic 38.5% |
| Spanish Americans | 0.0 /100 | #299 | Tragic 38.6% |
| Immigrants | West Indies | 0.0 /100 | #300 | Tragic 38.6% |
| Haitians | 0.0 /100 | #301 | Tragic 38.6% |
| Hondurans | 0.0 /100 | #302 | Tragic 38.7% |
| Immigrants | Jamaica | 0.0 /100 | #303 | Tragic 38.8% |
| Yaqui | 0.0 /100 | #304 | Tragic 38.8% |
| Immigrants | Haiti | 0.0 /100 | #305 | Tragic 38.9% |
Demographics Similar to Immigrants from Canada by Births to Unmarried Women
In terms of births to unmarried women, the demographic groups most similar to Immigrants from Canada are Puget Sound Salish (30.4%, a difference of 0.030%), Immigrants from Philippines (30.4%, a difference of 0.040%), Swiss (30.5%, a difference of 0.11%), Pakistani (30.5%, a difference of 0.13%), and Immigrants from Scotland (30.4%, a difference of 0.16%).
| Demographics | Rating | Rank | Births to Unmarried Women |
| New Zealanders | 85.5 /100 | #132 | Excellent 30.3% |
| Immigrants | Morocco | 85.2 /100 | #133 | Excellent 30.4% |
| Immigrants | South Eastern Asia | 85.2 /100 | #134 | Excellent 30.4% |
| Brazilians | 84.8 /100 | #135 | Excellent 30.4% |
| Immigrants | Scotland | 84.6 /100 | #136 | Excellent 30.4% |
| Immigrants | Philippines | 83.9 /100 | #137 | Excellent 30.4% |
| Puget Sound Salish | 83.9 /100 | #138 | Excellent 30.4% |
| Immigrants | Canada | 83.7 /100 | #139 | Excellent 30.4% |
| Swiss | 83.1 /100 | #140 | Excellent 30.5% |
| Pakistanis | 83.0 /100 | #141 | Excellent 30.5% |
| South Africans | 82.7 /100 | #142 | Excellent 30.5% |
| Immigrants | Uganda | 82.6 /100 | #143 | Excellent 30.5% |
| Czechs | 82.1 /100 | #144 | Excellent 30.5% |
| Immigrants | North America | 81.5 /100 | #145 | Excellent 30.6% |
| Northern Europeans | 81.4 /100 | #146 | Excellent 30.6% |