Tsimshian vs South American Associate's Degree
COMPARE
Tsimshian
South American
Associate's Degree
Associate's Degree Comparison
Tsimshian
South Americans
38.6%
ASSOCIATE'S DEGREE
0.0/ 100
METRIC RATING
301st/ 347
METRIC RANK
47.1%
ASSOCIATE'S DEGREE
70.5/ 100
METRIC RATING
156th/ 347
METRIC RANK
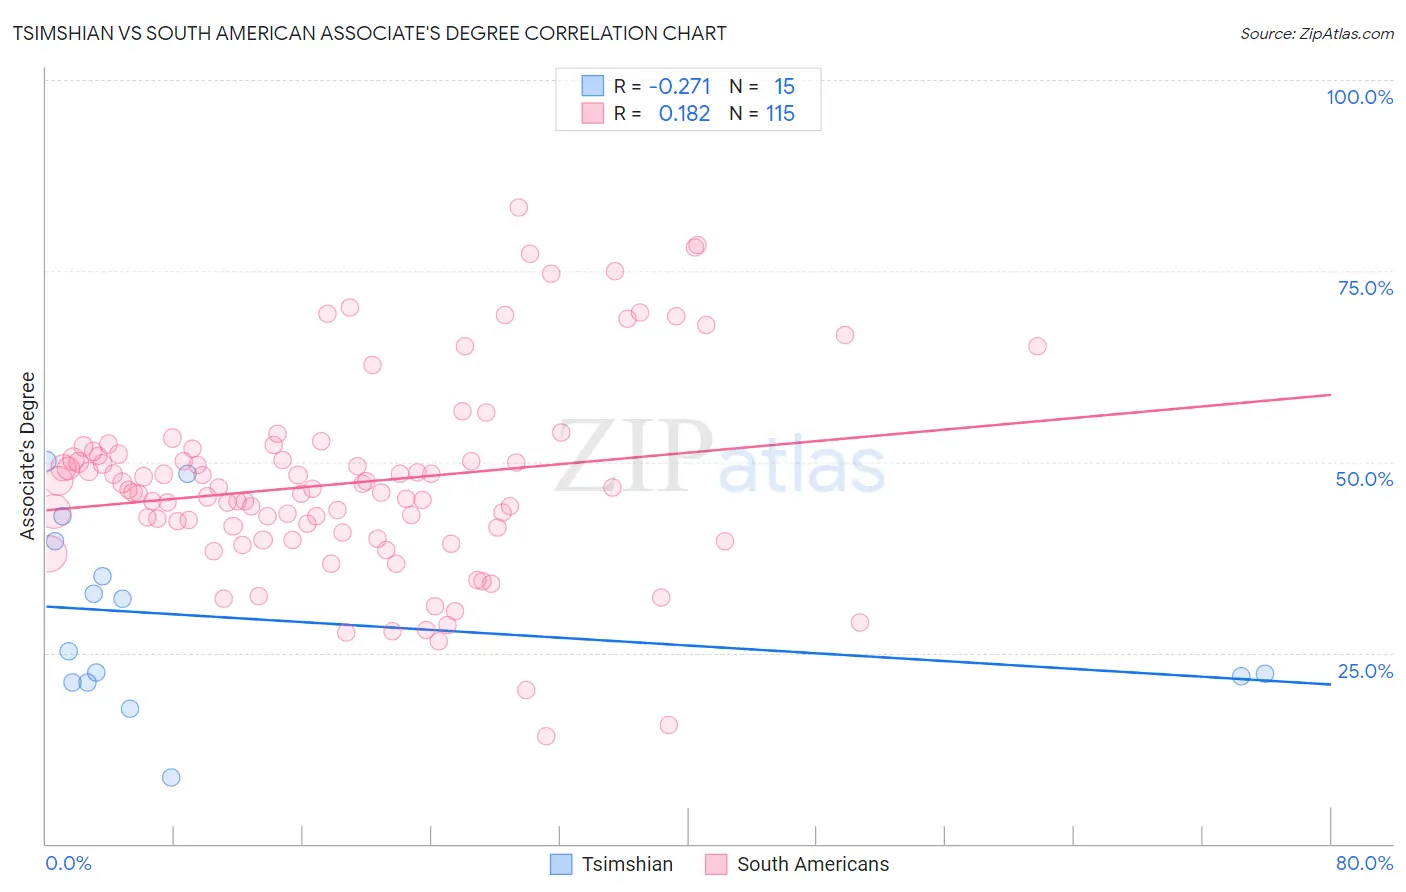
Tsimshian vs South American Associate's Degree Correlation Chart
The statistical analysis conducted on geographies consisting of 15,626,544 people shows a weak negative correlation between the proportion of Tsimshian and percentage of population with at least associate's degree education in the United States with a correlation coefficient (R) of -0.271 and weighted average of 38.6%. Similarly, the statistical analysis conducted on geographies consisting of 494,120,152 people shows a poor positive correlation between the proportion of South Americans and percentage of population with at least associate's degree education in the United States with a correlation coefficient (R) of 0.182 and weighted average of 47.1%, a difference of 22.1%.
Associate's Degree Correlation Summary
| Measurement | Tsimshian | South American |
| Minimum | 8.6% | 14.1% |
| Maximum | 50.0% | 83.4% |
| Range | 41.4% | 69.2% |
| Mean | 29.4% | 47.2% |
| Median | 25.2% | 46.3% |
| Interquartile 25% (IQ1) | 21.2% | 40.8% |
| Interquartile 75% (IQ3) | 39.6% | 51.0% |
| Interquartile Range (IQR) | 18.4% | 10.2% |
| Standard Deviation (Sample) | 12.0% | 12.9% |
| Standard Deviation (Population) | 11.5% | 12.8% |
Similar Demographics by Associate's Degree
Demographics Similar to Tsimshian by Associate's Degree
In terms of associate's degree, the demographic groups most similar to Tsimshian are Chickasaw (38.6%, a difference of 0.060%), Ute (38.6%, a difference of 0.090%), Colville (38.5%, a difference of 0.15%), Cheyenne (38.7%, a difference of 0.19%), and Guatemalan (38.5%, a difference of 0.24%).
| Demographics | Rating | Rank | Associate's Degree |
| Salvadorans | 0.0 /100 | #294 | Tragic 39.0% |
| Hondurans | 0.0 /100 | #295 | Tragic 38.9% |
| Cherokee | 0.0 /100 | #296 | Tragic 38.9% |
| Cape Verdeans | 0.0 /100 | #297 | Tragic 38.8% |
| Cheyenne | 0.0 /100 | #298 | Tragic 38.7% |
| Ute | 0.0 /100 | #299 | Tragic 38.6% |
| Chickasaw | 0.0 /100 | #300 | Tragic 38.6% |
| Tsimshian | 0.0 /100 | #301 | Tragic 38.6% |
| Colville | 0.0 /100 | #302 | Tragic 38.5% |
| Guatemalans | 0.0 /100 | #303 | Tragic 38.5% |
| Sioux | 0.0 /100 | #304 | Tragic 38.5% |
| Immigrants | Honduras | 0.0 /100 | #305 | Tragic 38.5% |
| Shoshone | 0.0 /100 | #306 | Tragic 38.4% |
| Immigrants | El Salvador | 0.0 /100 | #307 | Tragic 38.4% |
| Mexican American Indians | 0.0 /100 | #308 | Tragic 38.2% |
Demographics Similar to South Americans by Associate's Degree
In terms of associate's degree, the demographic groups most similar to South Americans are Kenyan (47.1%, a difference of 0.010%), Sudanese (47.1%, a difference of 0.020%), Immigrants from Germany (47.1%, a difference of 0.070%), Immigrants from Poland (47.1%, a difference of 0.12%), and Immigrants from Kenya (47.2%, a difference of 0.14%).
| Demographics | Rating | Rank | Associate's Degree |
| Immigrants | Armenia | 76.6 /100 | #149 | Good 47.4% |
| Iraqis | 76.2 /100 | #150 | Good 47.4% |
| Immigrants | North Macedonia | 76.0 /100 | #151 | Good 47.4% |
| Immigrants | Afghanistan | 74.3 /100 | #152 | Good 47.3% |
| Czechs | 72.2 /100 | #153 | Good 47.2% |
| Immigrants | Kenya | 72.1 /100 | #154 | Good 47.2% |
| Kenyans | 70.6 /100 | #155 | Good 47.1% |
| South Americans | 70.5 /100 | #156 | Good 47.1% |
| Sudanese | 70.3 /100 | #157 | Good 47.1% |
| Immigrants | Germany | 69.7 /100 | #158 | Good 47.1% |
| Immigrants | Poland | 69.2 /100 | #159 | Good 47.1% |
| Scottish | 65.4 /100 | #160 | Good 46.9% |
| Scandinavians | 65.2 /100 | #161 | Good 46.9% |
| Immigrants | Africa | 63.2 /100 | #162 | Good 46.8% |
| Somalis | 62.5 /100 | #163 | Good 46.8% |