Tsimshian vs Immigrants from Turkey Unemployment Among Seniors over 75 years

COMPARE

Tsimshian
Race
Ancestry
AfghanAfricanAlaska NativeAlaskan AthabascanAlbanianAleutAlsatianAmericanApacheArabArapahoArgentineanArmenianAssyrian/Chaldean/SyriacAustralianAustrianBahamianBangladeshiBarbadianBasqueBelgianBelizeanBermudanBhutaneseBlackfeetBolivianBrazilianBritishBritish West IndianBulgarianBurmeseCajunCambodianCanadianCape VerdeanCarpatho RusynCelticCentral AmericanCentral American IndianCherokeeCheyenneChickasawChileanChineseChippewaChoctawColombianColvilleComancheCosta RicanCreeCreekCroatianCrowCubanCypriotCzechCzechoslovakianDanishDelawareDominicanDutchDutch West IndianEastern EuropeanEcuadorianEgyptianEnglishEstonianEthiopianEuropeanFijianFilipinoFinnishFrenchFrench American IndianFrench CanadianGermanGerman RussianGhanaianGreekGuamanian/ChamorroGuatemalanGuyaneseHaitianHmongHonduranHopiHoumaHungarianIcelanderIndian (Asian)IndonesianInupiatIranianIraqiIrishIroquoisIsraeliItalianJamaicanJapaneseJordanianKenyanKiowaKoreanLaotianLatvianLebaneseLiberianLithuanianLumbeeLuxembourgerMacedonianMalaysianMalteseMarshalleseMexicanMexican American IndianMongolianMoroccanNative HawaiianNavajoNepaleseNew ZealanderNicaraguanNigerianNorthern EuropeanNorwegianOkinawanOsageOttawaPaiutePakistaniPalestinianPanamanianParaguayanPennsylvania GermanPeruvianPimaPolishPortuguesePotawatomiPuebloPuerto RicanPuget Sound SalishRomanianRussianSalvadoranSamoanScandinavianScotch-IrishScottishSeminoleSenegaleseSerbianShoshoneSierra LeoneanSiouxSlavicSlovakSloveneSomaliSouth AfricanSouth AmericanSouth American IndianSoviet UnionSpaniardSpanishSpanish AmericanSpanish American IndianSri LankanSubsaharan AfricanSudaneseSwedishSwissSyrianTaiwaneseThaiTlingit-HaidaTohono O'OdhamTonganTrinidadian and TobagonianTsimshianTurkishU.S. Virgin IslanderUgandanUkrainianUruguayanUteVenezuelanVietnameseWelshWest IndianYakamaYaquiYugoslavianYumanYup'ikZimbabwean
Immigration
NonimmigrantsImmigrantsAfghanistanAfricaAlbaniaArgentinaArmeniaAsiaAustraliaAustriaBahamasBangladeshBarbadosBelarusBelgiumBelizeBoliviaBosnia and HerzegovinaBrazilBulgariaBurma/MyanmarCabo VerdeCambodiaCameroonCanadaCaribbeanCentral AmericaChileChinaColombiaCongoCosta RicaCroatiaCubaCzechoslovakiaDenmarkDominicaDominican RepublicEastern AfricaEastern AsiaEastern EuropeEcuadorEgyptEl SalvadorEnglandEritreaEthiopiaEuropeFijiFranceGermanyGhanaGreeceGrenadaGuatemalaGuyanaHaitiHondurasHong KongHungaryIndiaIndonesiaIranIraqIrelandIsraelItalyJamaicaJapanJordanKazakhstanKenyaKoreaKuwaitLaosLatin AmericaLatviaLebanonLiberiaLithuaniaMalaysiaMexicoMicronesiaMiddle AfricaMoldovaMoroccoNepalNetherlandsNicaraguaNigeriaNorth AmericaNorth MacedoniaNorthern AfricaNorthern EuropeNorwayOceaniaPakistanPanamaPeruPhilippinesPolandPortugalRomaniaRussiaSaudi ArabiaScotlandSenegalSerbiaSierra LeoneSingaporeSomaliaSouth AfricaSouth AmericaSouth Central AsiaSouth Eastern AsiaSouthern EuropeSpainSri LankaSt. Vincent and the GrenadinesSudanSwedenSwitzerlandSyriaTaiwanThailandTrinidad and TobagoUgandaUkraineUruguayUzbekistanVenezuelaVietnamWest IndiesWestern AfricaWestern AsiaWestern EuropeYemenZaireZimbabweAzores
Immigrants from Turkey
Race
Ancestry
AfghanAfricanAlaska NativeAlaskan AthabascanAlbanianAleutAlsatianAmericanApacheArabArapahoArgentineanArmenianAssyrian/Chaldean/SyriacAustralianAustrianBahamianBangladeshiBarbadianBasqueBelgianBelizeanBermudanBhutaneseBlackfeetBolivianBrazilianBritishBritish West IndianBulgarianBurmeseCajunCambodianCanadianCape VerdeanCarpatho RusynCelticCentral AmericanCentral American IndianCherokeeCheyenneChickasawChileanChineseChippewaChoctawColombianColvilleComancheCosta RicanCreeCreekCroatianCrowCubanCypriotCzechCzechoslovakianDanishDelawareDominicanDutchDutch West IndianEastern EuropeanEcuadorianEgyptianEnglishEstonianEthiopianEuropeanFijianFilipinoFinnishFrenchFrench American IndianFrench CanadianGermanGerman RussianGhanaianGreekGuamanian/ChamorroGuatemalanGuyaneseHaitianHmongHonduranHopiHoumaHungarianIcelanderIndian (Asian)IndonesianInupiatIranianIraqiIrishIroquoisIsraeliItalianJamaicanJapaneseJordanianKenyanKiowaKoreanLaotianLatvianLebaneseLiberianLithuanianLumbeeLuxembourgerMacedonianMalaysianMalteseMarshalleseMexicanMexican American IndianMongolianMoroccanNative HawaiianNavajoNepaleseNew ZealanderNicaraguanNigerianNorthern EuropeanNorwegianOkinawanOsageOttawaPaiutePakistaniPalestinianPanamanianParaguayanPennsylvania GermanPeruvianPimaPolishPortuguesePotawatomiPuebloPuerto RicanPuget Sound SalishRomanianRussianSalvadoranSamoanScandinavianScotch-IrishScottishSeminoleSenegaleseSerbianShoshoneSierra LeoneanSiouxSlavicSlovakSloveneSomaliSouth AfricanSouth AmericanSouth American IndianSoviet UnionSpaniardSpanishSpanish AmericanSpanish American IndianSri LankanSubsaharan AfricanSudaneseSwedishSwissSyrianTaiwaneseThaiTlingit-HaidaTohono O'OdhamTonganTrinidadian and TobagonianTurkishU.S. Virgin IslanderUgandanUkrainianUruguayanUteVenezuelanVietnameseWelshWest IndianYakamaYaquiYugoslavianYumanYup'ikZimbabwean
Immigration
NonimmigrantsImmigrantsAfghanistanAfricaAlbaniaArgentinaArmeniaAsiaAustraliaAustriaBahamasBangladeshBarbadosBelarusBelgiumBelizeBoliviaBosnia and HerzegovinaBrazilBulgariaBurma/MyanmarCabo VerdeCambodiaCameroonCanadaCaribbeanCentral AmericaChileChinaColombiaCongoCosta RicaCroatiaCubaCzechoslovakiaDenmarkDominicaDominican RepublicEastern AfricaEastern AsiaEastern EuropeEcuadorEgyptEl SalvadorEnglandEritreaEthiopiaEuropeFijiFranceGermanyGhanaGreeceGrenadaGuatemalaGuyanaHaitiHondurasHong KongHungaryIndiaIndonesiaIranIraqIrelandIsraelItalyJamaicaJapanJordanKazakhstanKenyaKoreaKuwaitLaosLatin AmericaLatviaLebanonLiberiaLithuaniaMalaysiaMexicoMicronesiaMiddle AfricaMoldovaMoroccoNepalNetherlandsNicaraguaNigeriaNorth AmericaNorth MacedoniaNorthern AfricaNorthern EuropeNorwayOceaniaPakistanPanamaPeruPhilippinesPolandPortugalRomaniaRussiaSaudi ArabiaScotlandSenegalSerbiaSierra LeoneSingaporeSomaliaSouth AfricaSouth AmericaSouth Central AsiaSouth Eastern AsiaSouthern EuropeSpainSri LankaSt. Vincent and the GrenadinesSudanSwedenSwitzerlandSyriaTaiwanThailandTrinidad and TobagoTurkeyUgandaUkraineUruguayUzbekistanVenezuelaVietnamWest IndiesWestern AfricaWestern AsiaWestern EuropeYemenZaireZimbabweAzores
Unemployment Among Seniors over 75 years
Income
Poverty
Unemployment
Labor Participation
Family Structure
Vehicle Availability
Education Level
Disability

Unemployment Among Seniors over 75 years Comparison

Tsimshian

Immigrants from Turkey

Tragic
Exceptional
10.5%
UNEMPLOYMENT AMONG SENIORS OVER 75 YEARS
0.0/ 100
METRIC RATING
329th/ 347
METRIC RANK
8.0%
UNEMPLOYMENT AMONG SENIORS OVER 75 YEARS
99.8/ 100
METRIC RATING
77th/ 347
METRIC RANK

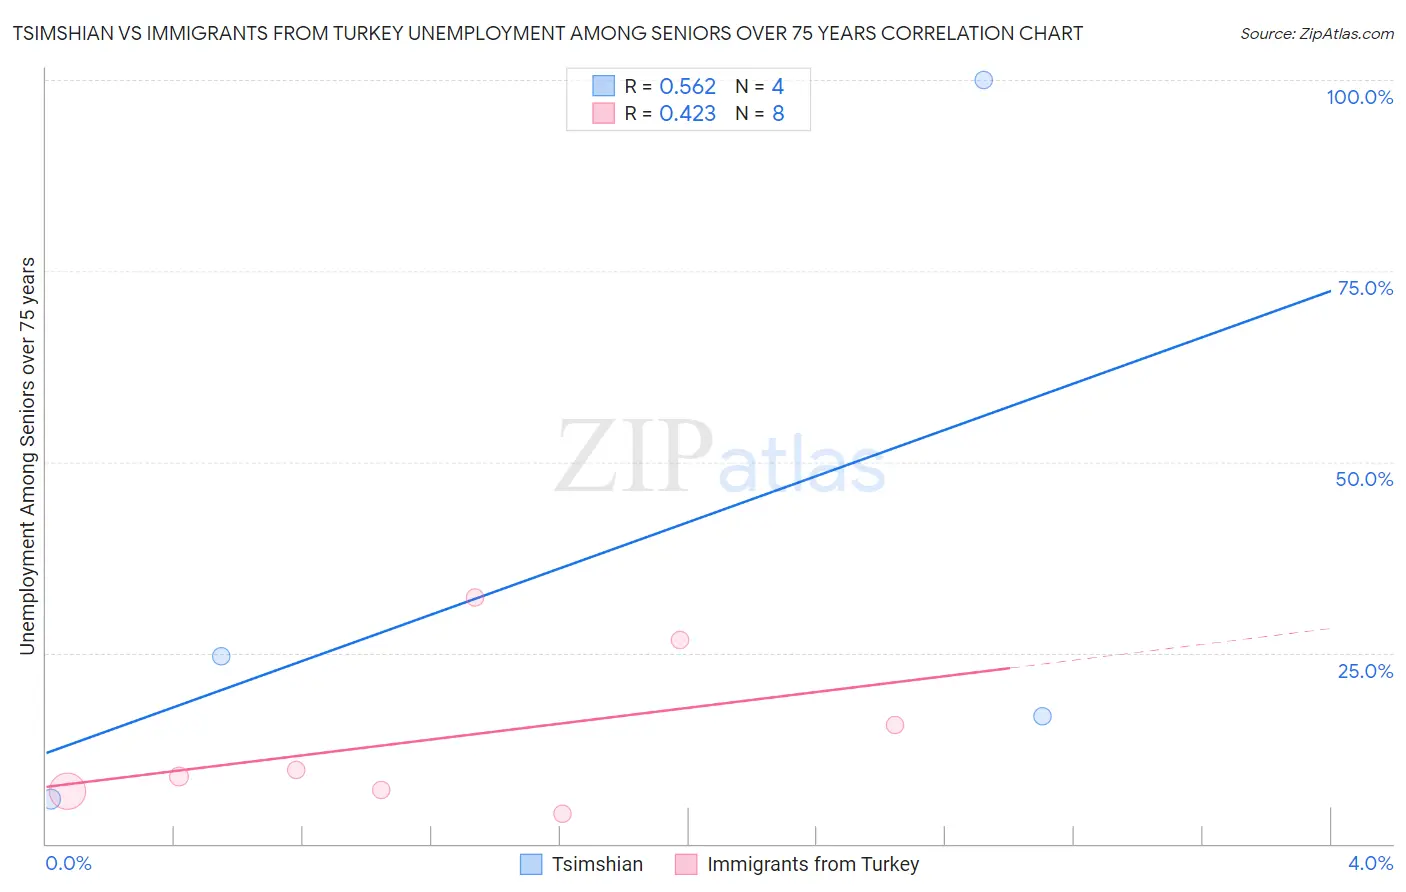
Tsimshian vs Immigrants from Turkey Unemployment Among Seniors over 75 years Correlation Chart

The statistical analysis conducted on geographies consisting of 12,337,833 people shows a substantial positive correlation between the proportion of Tsimshian and unemployment rate among seniors over the age of 75 in the United States with a correlation coefficient (R) of 0.562 and weighted average of 10.5%. Similarly, the statistical analysis conducted on geographies consisting of 142,277,289 people shows a moderate positive correlation between the proportion of Immigrants from Turkey and unemployment rate among seniors over the age of 75 in the United States with a correlation coefficient (R) of 0.423 and weighted average of 8.0%, a difference of 31.3%.
Tsimshian vs Immigrants from Turkey Unemployment Among Seniors over 75 years

Unemployment Among Seniors over 75 years Correlation Summary

MeasurementTsimshianImmigrants from Turkey
Minimum5.9%3.9%
Maximum100.0%32.3%
Range94.1%28.3%
Mean36.8%13.8%
Median20.6%9.2%
Interquartile 25% (IQ1)11.3%6.9%
Interquartile 75% (IQ3)62.3%21.1%
Interquartile Range (IQR)51.0%14.2%
Standard Deviation (Sample)42.8%10.3%
Standard Deviation (Population)37.1%9.6%

Similar Demographics by Unemployment Among Seniors over 75 years

Demographics Similar to Tsimshian by Unemployment Among Seniors over 75 years

In terms of unemployment among seniors over 75 years, the demographic groups most similar to Tsimshian are Immigrants from Portugal (10.5%, a difference of 0.35%), Dutch (10.4%, a difference of 0.99%), Slovak (10.4%, a difference of 1.1%), Portuguese (10.4%, a difference of 1.3%), and American (10.4%, a difference of 1.5%).
DemographicsRating | RankUnemployment Among Seniors over 75 years
Poles
0.0
/100
|
#322
Tragic
10.3%
Tongans
0.0
/100
|
#323
Tragic
10.4%
Americans
0.0
/100
|
#324
Tragic
10.4%
Portuguese
0.0
/100
|
#325
Tragic
10.4%
Slovaks
0.0
/100
|
#326
Tragic
10.4%
Dutch
0.0
/100
|
#327
Tragic
10.4%
Immigrants | Portugal
0.0
/100
|
#328
Tragic
10.5%
Tsimshian
0.0
/100
|
#329
Tragic
10.5%
Immigrants | Azores
0.0
/100
|
#330
Tragic
10.7%
Tohono O'odham
0.0
/100
|
#331
Tragic
10.8%
Immigrants | Liberia
0.0
/100
|
#332
Tragic
10.9%
Alaskan Athabascans
0.0
/100
|
#333
Tragic
11.0%
Assyrians/Chaldeans/Syriacs
0.0
/100
|
#334
Tragic
11.1%
French Canadians
0.0
/100
|
#335
Tragic
11.2%
Immigrants | North Macedonia
0.0
/100
|
#336
Tragic
11.3%

Demographics Similar to Immigrants from Turkey by Unemployment Among Seniors over 75 years

In terms of unemployment among seniors over 75 years, the demographic groups most similar to Immigrants from Turkey are Immigrants from Belarus (8.0%, a difference of 0.030%), Immigrants from Venezuela (8.0%, a difference of 0.050%), Immigrants from Uganda (8.0%, a difference of 0.16%), Immigrants from Japan (8.0%, a difference of 0.24%), and Immigrants from Australia (8.0%, a difference of 0.25%).
DemographicsRating | RankUnemployment Among Seniors over 75 years
Immigrants | Argentina
99.9
/100
|
#70
Exceptional
8.0%
Immigrants | Cambodia
99.9
/100
|
#71
Exceptional
8.0%
Bolivians
99.9
/100
|
#72
Exceptional
8.0%
Immigrants | France
99.9
/100
|
#73
Exceptional
8.0%
Spanish Americans
99.8
/100
|
#74
Exceptional
8.0%
Immigrants | Uganda
99.8
/100
|
#75
Exceptional
8.0%
Immigrants | Venezuela
99.8
/100
|
#76
Exceptional
8.0%
Immigrants | Turkey
99.8
/100
|
#77
Exceptional
8.0%
Immigrants | Belarus
99.8
/100
|
#78
Exceptional
8.0%
Immigrants | Japan
99.7
/100
|
#79
Exceptional
8.0%
Immigrants | Australia
99.7
/100
|
#80
Exceptional
8.0%
Cubans
99.7
/100
|
#81
Exceptional
8.0%
Bhutanese
99.7
/100
|
#82
Exceptional
8.0%
Arapaho
99.7
/100
|
#83
Exceptional
8.1%
U.S. Virgin Islanders
99.7
/100
|
#84
Exceptional
8.1%