Tsimshian vs Brazilian Child Poverty Under the Age of 16
COMPARE
Tsimshian
Brazilian
Child Poverty Under the Age of 16
Child Poverty Under the Age of 16 Comparison
Tsimshian
Brazilians
14.1%
CHILD POVERTY UNDER THE AGE OF 16
98.8/ 100
METRIC RATING
54th/ 347
METRIC RANK
15.4%
CHILD POVERTY UNDER THE AGE OF 16
82.8/ 100
METRIC RATING
142nd/ 347
METRIC RANK
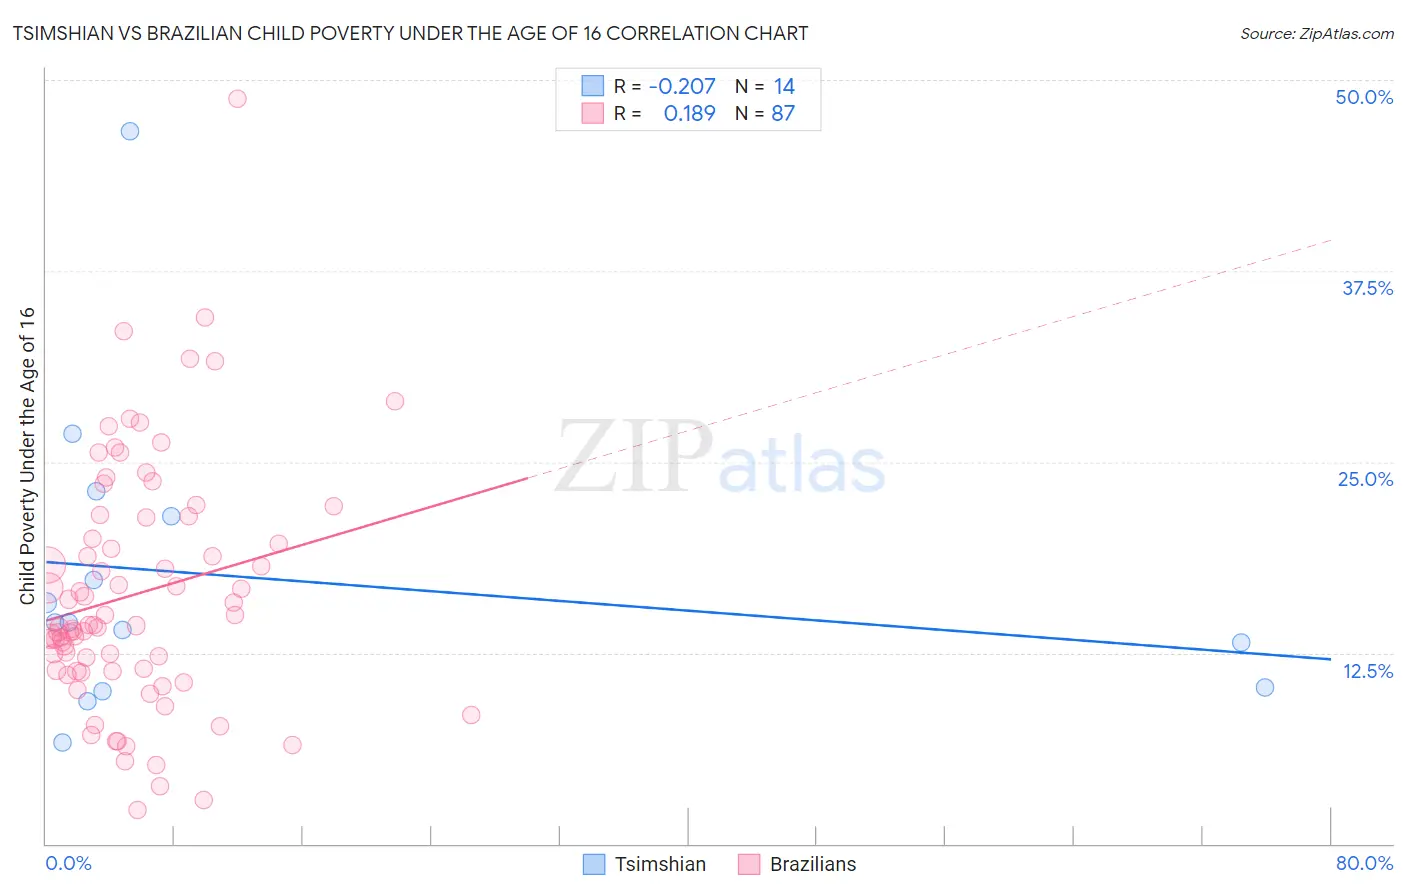
Tsimshian vs Brazilian Child Poverty Under the Age of 16 Correlation Chart
The statistical analysis conducted on geographies consisting of 15,622,353 people shows a weak negative correlation between the proportion of Tsimshian and poverty level among children under the age of 16 in the United States with a correlation coefficient (R) of -0.207 and weighted average of 14.1%. Similarly, the statistical analysis conducted on geographies consisting of 321,388,637 people shows a poor positive correlation between the proportion of Brazilians and poverty level among children under the age of 16 in the United States with a correlation coefficient (R) of 0.189 and weighted average of 15.4%, a difference of 9.7%.
Child Poverty Under the Age of 16 Correlation Summary
| Measurement | Tsimshian | Brazilian |
| Minimum | 6.7% | 2.2% |
| Maximum | 46.7% | 48.8% |
| Range | 40.0% | 46.6% |
| Mean | 17.4% | 16.3% |
| Median | 14.5% | 14.3% |
| Interquartile 25% (IQ1) | 10.2% | 11.3% |
| Interquartile 75% (IQ3) | 21.4% | 21.3% |
| Interquartile Range (IQR) | 11.2% | 10.0% |
| Standard Deviation (Sample) | 10.1% | 8.0% |
| Standard Deviation (Population) | 9.7% | 8.0% |
Similar Demographics by Child Poverty Under the Age of 16
Demographics Similar to Tsimshian by Child Poverty Under the Age of 16
In terms of child poverty under the age of 16, the demographic groups most similar to Tsimshian are Immigrants from Israel (14.1%, a difference of 0.020%), Immigrants from Indonesia (14.1%, a difference of 0.070%), Immigrants from Serbia (14.1%, a difference of 0.24%), Immigrants from Belgium (14.1%, a difference of 0.33%), and Polish (14.0%, a difference of 0.34%).
| Demographics | Rating | Rank | Child Poverty Under the Age of 16 |
| Estonians | 99.2 /100 | #47 | Exceptional 13.9% |
| Koreans | 99.2 /100 | #48 | Exceptional 13.9% |
| Italians | 99.2 /100 | #49 | Exceptional 13.9% |
| Immigrants | Czechoslovakia | 99.1 /100 | #50 | Exceptional 13.9% |
| Immigrants | Greece | 99.1 /100 | #51 | Exceptional 13.9% |
| Poles | 98.9 /100 | #52 | Exceptional 14.0% |
| Immigrants | Israel | 98.8 /100 | #53 | Exceptional 14.1% |
| Tsimshian | 98.8 /100 | #54 | Exceptional 14.1% |
| Immigrants | Indonesia | 98.7 /100 | #55 | Exceptional 14.1% |
| Immigrants | Serbia | 98.7 /100 | #56 | Exceptional 14.1% |
| Immigrants | Belgium | 98.6 /100 | #57 | Exceptional 14.1% |
| Immigrants | Pakistan | 98.6 /100 | #58 | Exceptional 14.1% |
| Scandinavians | 98.6 /100 | #59 | Exceptional 14.1% |
| Immigrants | Austria | 98.5 /100 | #60 | Exceptional 14.2% |
| Immigrants | Sweden | 98.5 /100 | #61 | Exceptional 14.2% |
Demographics Similar to Brazilians by Child Poverty Under the Age of 16
In terms of child poverty under the age of 16, the demographic groups most similar to Brazilians are Icelander (15.4%, a difference of 0.070%), Immigrants from Hungary (15.5%, a difference of 0.19%), Immigrants from Peru (15.5%, a difference of 0.24%), Slovak (15.5%, a difference of 0.28%), and Slavic (15.4%, a difference of 0.34%).
| Demographics | Rating | Rank | Child Poverty Under the Age of 16 |
| Albanians | 88.6 /100 | #135 | Excellent 15.2% |
| Immigrants | Spain | 87.3 /100 | #136 | Excellent 15.3% |
| Peruvians | 87.2 /100 | #137 | Excellent 15.3% |
| Welsh | 87.2 /100 | #138 | Excellent 15.3% |
| Immigrants | Vietnam | 87.1 /100 | #139 | Excellent 15.3% |
| New Zealanders | 86.9 /100 | #140 | Excellent 15.3% |
| Slavs | 84.2 /100 | #141 | Excellent 15.4% |
| Brazilians | 82.8 /100 | #142 | Excellent 15.4% |
| Icelanders | 82.5 /100 | #143 | Excellent 15.4% |
| Immigrants | Hungary | 81.9 /100 | #144 | Excellent 15.5% |
| Immigrants | Peru | 81.7 /100 | #145 | Excellent 15.5% |
| Slovaks | 81.4 /100 | #146 | Excellent 15.5% |
| Immigrants | Kuwait | 80.5 /100 | #147 | Excellent 15.5% |
| Puget Sound Salish | 80.3 /100 | #148 | Excellent 15.5% |
| Israelis | 80.1 /100 | #149 | Excellent 15.5% |