Trinidadian and Tobagonian vs Immigrants from Uzbekistan Family Households
COMPARE
Trinidadian and Tobagonian
Immigrants from Uzbekistan
Family Households
Family Households Comparison
Trinidadians and Tobagonians
Immigrants from Uzbekistan
63.6%
FAMILY HOUSEHOLDS
4.1/ 100
METRIC RATING
227th/ 347
METRIC RANK
63.4%
FAMILY HOUSEHOLDS
1.5/ 100
METRIC RATING
247th/ 347
METRIC RANK
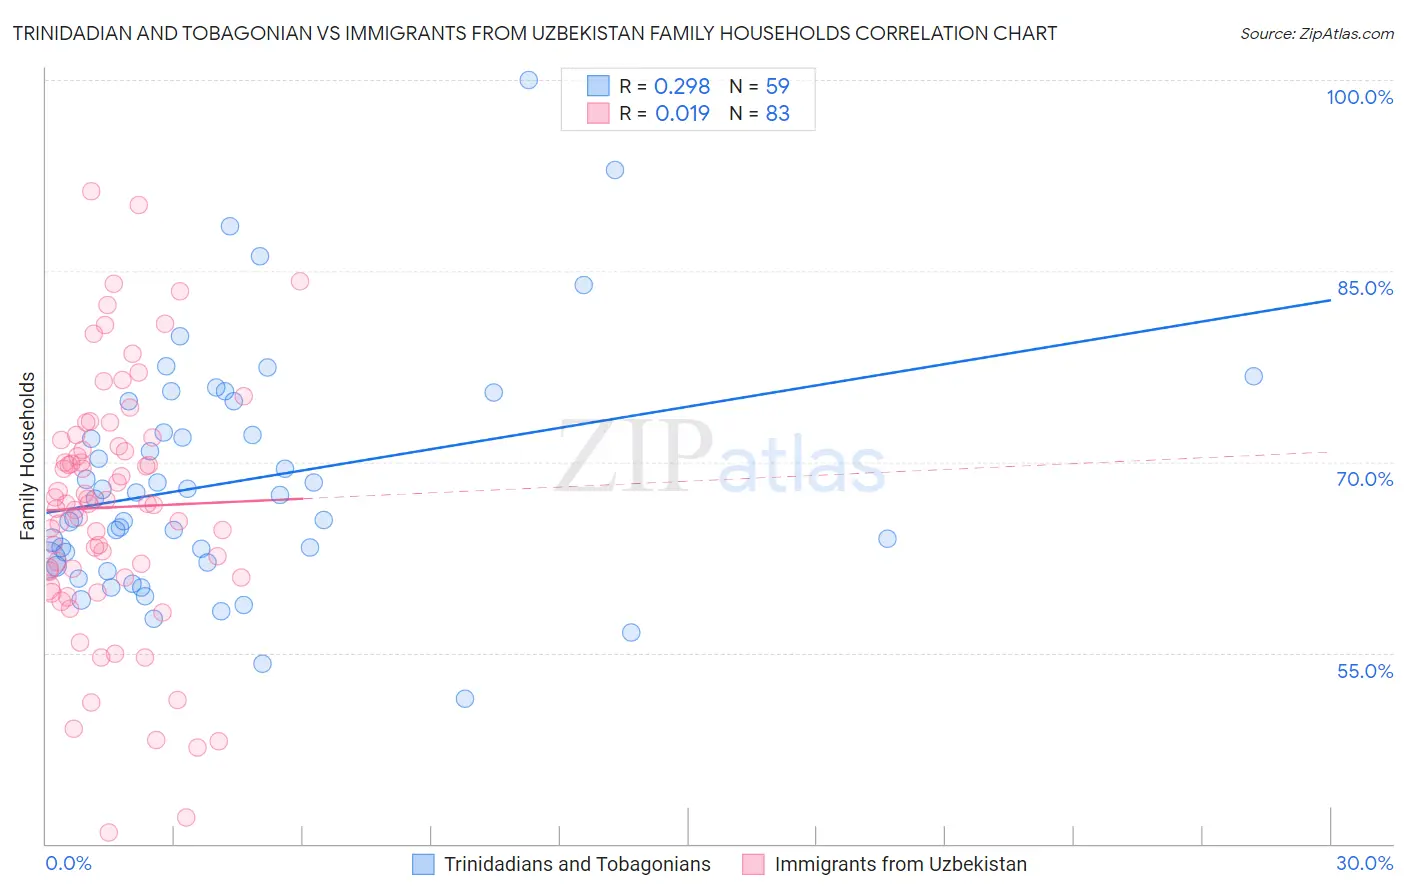
Trinidadian and Tobagonian vs Immigrants from Uzbekistan Family Households Correlation Chart
The statistical analysis conducted on geographies consisting of 219,716,618 people shows a weak positive correlation between the proportion of Trinidadians and Tobagonians and percentage of family households in the United States with a correlation coefficient (R) of 0.298 and weighted average of 63.6%. Similarly, the statistical analysis conducted on geographies consisting of 118,723,370 people shows no correlation between the proportion of Immigrants from Uzbekistan and percentage of family households in the United States with a correlation coefficient (R) of 0.019 and weighted average of 63.4%, a difference of 0.35%.
Family Households Correlation Summary
| Measurement | Trinidadian and Tobagonian | Immigrants from Uzbekistan |
| Minimum | 51.4% | 40.8% |
| Maximum | 100.0% | 91.2% |
| Range | 48.6% | 50.4% |
| Mean | 68.4% | 66.4% |
| Median | 67.1% | 66.7% |
| Interquartile 25% (IQ1) | 62.1% | 60.9% |
| Interquartile 75% (IQ3) | 74.7% | 71.7% |
| Interquartile Range (IQR) | 12.7% | 10.8% |
| Standard Deviation (Sample) | 9.3% | 9.9% |
| Standard Deviation (Population) | 9.2% | 9.9% |
Demographics Similar to Trinidadians and Tobagonians and Immigrants from Uzbekistan by Family Households
In terms of family households, the demographic groups most similar to Trinidadians and Tobagonians are Blackfeet (63.6%, a difference of 0.050%), Bulgarian (63.6%, a difference of 0.070%), Immigrants from Brazil (63.6%, a difference of 0.11%), Immigrants from Greece (63.5%, a difference of 0.12%), and Immigrants from Northern Africa (63.5%, a difference of 0.16%). Similarly, the demographic groups most similar to Immigrants from Uzbekistan are Immigrants from Ghana (63.4%, a difference of 0.010%), Eastern European (63.4%, a difference of 0.030%), Immigrants from Dominica (63.4%, a difference of 0.030%), Immigrants from Czechoslovakia (63.4%, a difference of 0.050%), and Immigrants from St. Vincent and the Grenadines (63.4%, a difference of 0.070%).
| Demographics | Rating | Rank | Family Households |
| Trinidadians and Tobagonians | 4.1 /100 | #227 | Tragic 63.6% |
| Blackfeet | 3.6 /100 | #228 | Tragic 63.6% |
| Bulgarians | 3.4 /100 | #229 | Tragic 63.6% |
| Immigrants | Brazil | 3.0 /100 | #230 | Tragic 63.6% |
| Immigrants | Greece | 2.9 /100 | #231 | Tragic 63.5% |
| Immigrants | Northern Africa | 2.6 /100 | #232 | Tragic 63.5% |
| Immigrants | Armenia | 2.6 /100 | #233 | Tragic 63.5% |
| Finns | 2.3 /100 | #234 | Tragic 63.5% |
| Albanians | 2.2 /100 | #235 | Tragic 63.5% |
| Ghanaians | 2.1 /100 | #236 | Tragic 63.5% |
| Comanche | 2.1 /100 | #237 | Tragic 63.5% |
| Immigrants | Zimbabwe | 2.0 /100 | #238 | Tragic 63.5% |
| Aleuts | 1.9 /100 | #239 | Tragic 63.4% |
| South Africans | 1.9 /100 | #240 | Tragic 63.4% |
| Immigrants | St. Vincent and the Grenadines | 1.9 /100 | #241 | Tragic 63.4% |
| Immigrants | Israel | 1.8 /100 | #242 | Tragic 63.4% |
| Immigrants | Czechoslovakia | 1.8 /100 | #243 | Tragic 63.4% |
| Eastern Europeans | 1.6 /100 | #244 | Tragic 63.4% |
| Immigrants | Dominica | 1.6 /100 | #245 | Tragic 63.4% |
| Immigrants | Ghana | 1.6 /100 | #246 | Tragic 63.4% |
| Immigrants | Uzbekistan | 1.5 /100 | #247 | Tragic 63.4% |