Immigrants from Korea vs Colombian Family Households with Children
COMPARE
Immigrants from Korea
Colombian
Family Households with Children
Family Households with Children Comparison
Immigrants from Korea
Colombians
28.5%
FAMILY HOUSEHOLDS WITH CHILDREN
99.9/ 100
METRIC RATING
69th/ 347
METRIC RANK
28.3%
FAMILY HOUSEHOLDS WITH CHILDREN
99.6/ 100
METRIC RATING
87th/ 347
METRIC RANK
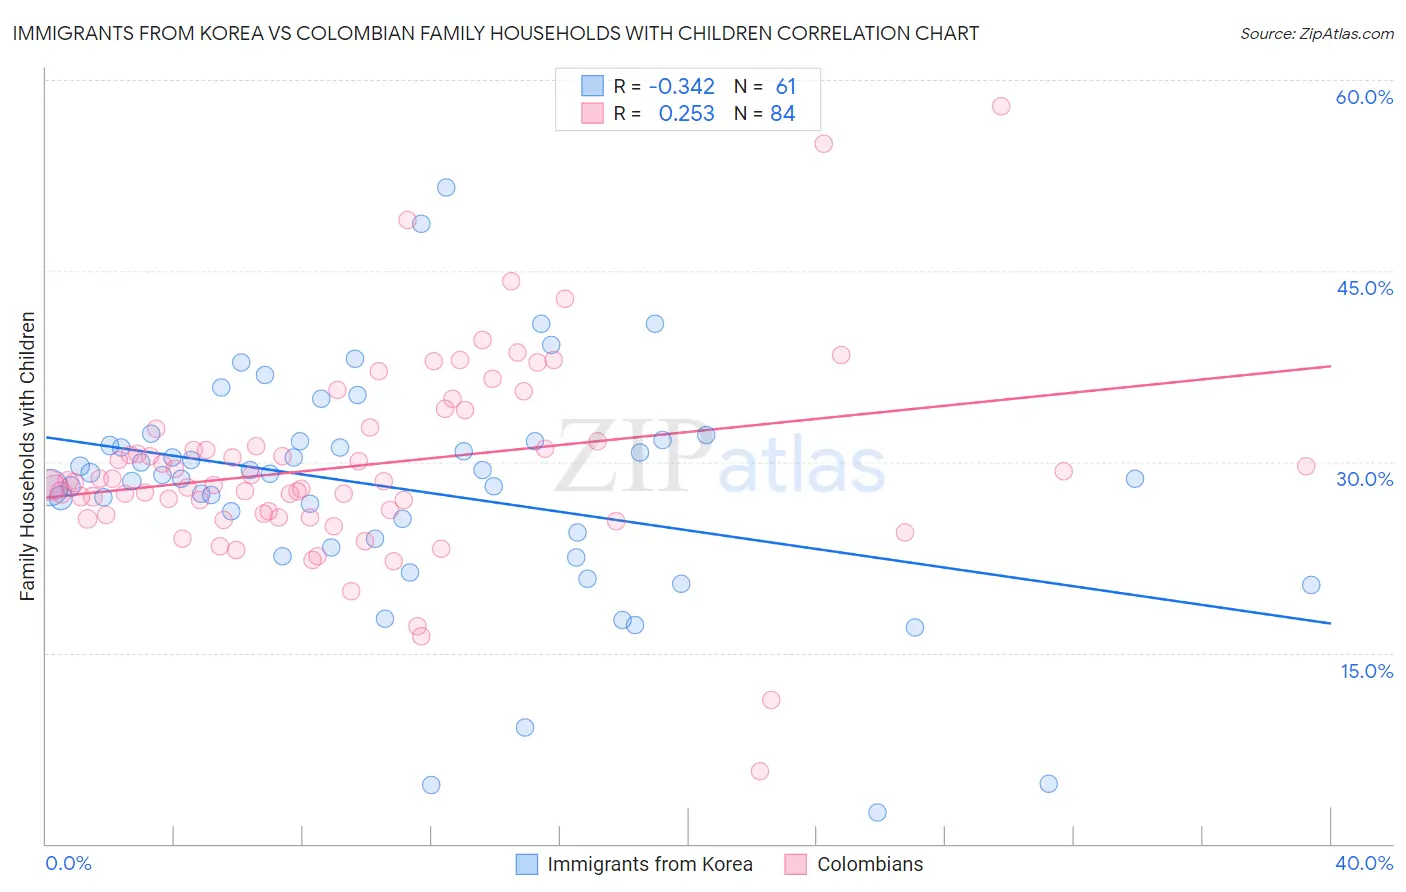
Immigrants from Korea vs Colombian Family Households with Children Correlation Chart
The statistical analysis conducted on geographies consisting of 415,788,077 people shows a mild negative correlation between the proportion of Immigrants from Korea and percentage of family households with children in the United States with a correlation coefficient (R) of -0.342 and weighted average of 28.5%. Similarly, the statistical analysis conducted on geographies consisting of 419,165,889 people shows a weak positive correlation between the proportion of Colombians and percentage of family households with children in the United States with a correlation coefficient (R) of 0.253 and weighted average of 28.3%, a difference of 0.84%.
Family Households with Children Correlation Summary
| Measurement | Immigrants from Korea | Colombian |
| Minimum | 2.4% | 5.7% |
| Maximum | 51.5% | 57.9% |
| Range | 49.1% | 52.2% |
| Mean | 27.8% | 29.7% |
| Median | 29.0% | 28.4% |
| Interquartile 25% (IQ1) | 23.6% | 25.9% |
| Interquartile 75% (IQ3) | 31.6% | 32.1% |
| Interquartile Range (IQR) | 8.0% | 6.3% |
| Standard Deviation (Sample) | 9.0% | 7.7% |
| Standard Deviation (Population) | 9.0% | 7.7% |
Demographics Similar to Immigrants from Korea and Colombians by Family Households with Children
In terms of family households with children, the demographic groups most similar to Immigrants from Korea are Houma (28.5%, a difference of 0.020%), Immigrants from Honduras (28.5%, a difference of 0.050%), Burmese (28.5%, a difference of 0.070%), Immigrants from Indonesia (28.5%, a difference of 0.080%), and Iraqi (28.5%, a difference of 0.11%). Similarly, the demographic groups most similar to Colombians are Liberian (28.3%, a difference of 0.010%), Immigrants from Western Africa (28.3%, a difference of 0.060%), Immigrants from Syria (28.4%, a difference of 0.31%), Nicaraguan (28.4%, a difference of 0.33%), and Costa Rican (28.4%, a difference of 0.33%).
| Demographics | Rating | Rank | Family Households with Children |
| Houma | 99.9 /100 | #68 | Exceptional 28.5% |
| Immigrants | Korea | 99.9 /100 | #69 | Exceptional 28.5% |
| Immigrants | Honduras | 99.9 /100 | #70 | Exceptional 28.5% |
| Burmese | 99.9 /100 | #71 | Exceptional 28.5% |
| Immigrants | Indonesia | 99.9 /100 | #72 | Exceptional 28.5% |
| Iraqis | 99.9 /100 | #73 | Exceptional 28.5% |
| Laotians | 99.9 /100 | #74 | Exceptional 28.5% |
| Immigrants | Jordan | 99.9 /100 | #75 | Exceptional 28.4% |
| Immigrants | Sri Lanka | 99.9 /100 | #76 | Exceptional 28.4% |
| Nigerians | 99.8 /100 | #77 | Exceptional 28.4% |
| Immigrants | Nepal | 99.8 /100 | #78 | Exceptional 28.4% |
| Immigrants | Iraq | 99.8 /100 | #79 | Exceptional 28.4% |
| Natives/Alaskans | 99.8 /100 | #80 | Exceptional 28.4% |
| South Americans | 99.8 /100 | #81 | Exceptional 28.4% |
| Kenyans | 99.8 /100 | #82 | Exceptional 28.4% |
| Nicaraguans | 99.8 /100 | #83 | Exceptional 28.4% |
| Costa Ricans | 99.8 /100 | #84 | Exceptional 28.4% |
| Immigrants | Syria | 99.8 /100 | #85 | Exceptional 28.4% |
| Immigrants | Western Africa | 99.6 /100 | #86 | Exceptional 28.3% |
| Colombians | 99.6 /100 | #87 | Exceptional 28.3% |
| Liberians | 99.6 /100 | #88 | Exceptional 28.3% |