Trinidadian and Tobagonian vs Colombian Unemployment
COMPARE
Trinidadian and Tobagonian
Colombian
Unemployment
Unemployment Comparison
Trinidadians and Tobagonians
Colombians
6.3%
UNEMPLOYMENT
0.0/ 100
METRIC RATING
301st/ 347
METRIC RANK
5.2%
UNEMPLOYMENT
61.1/ 100
METRIC RATING
167th/ 347
METRIC RANK
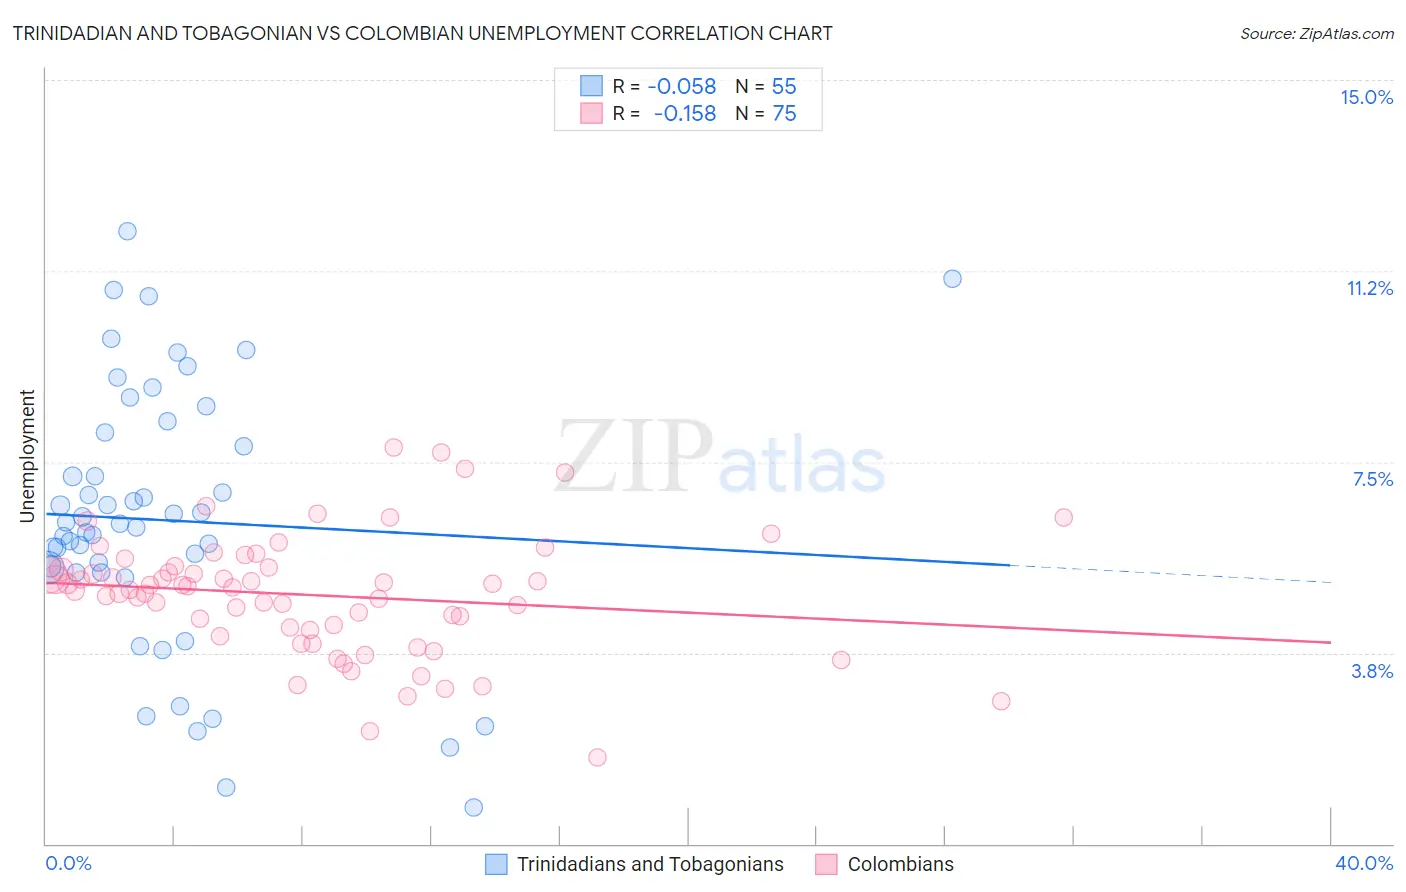
Trinidadian and Tobagonian vs Colombian Unemployment Correlation Chart
The statistical analysis conducted on geographies consisting of 219,752,630 people shows a slight negative correlation between the proportion of Trinidadians and Tobagonians and unemployment in the United States with a correlation coefficient (R) of -0.058 and weighted average of 6.3%. Similarly, the statistical analysis conducted on geographies consisting of 419,300,777 people shows a poor negative correlation between the proportion of Colombians and unemployment in the United States with a correlation coefficient (R) of -0.158 and weighted average of 5.2%, a difference of 21.5%.
Unemployment Correlation Summary
| Measurement | Trinidadian and Tobagonian | Colombian |
| Minimum | 0.70% | 1.7% |
| Maximum | 12.0% | 7.8% |
| Range | 11.3% | 6.1% |
| Mean | 6.4% | 4.9% |
| Median | 6.3% | 5.0% |
| Interquartile 25% (IQ1) | 5.3% | 4.2% |
| Interquartile 75% (IQ3) | 8.1% | 5.4% |
| Interquartile Range (IQR) | 2.7% | 1.2% |
| Standard Deviation (Sample) | 2.6% | 1.2% |
| Standard Deviation (Population) | 2.6% | 1.2% |
Similar Demographics by Unemployment
Demographics Similar to Trinidadians and Tobagonians by Unemployment
In terms of unemployment, the demographic groups most similar to Trinidadians and Tobagonians are West Indian (6.4%, a difference of 0.25%), Immigrants from Trinidad and Tobago (6.3%, a difference of 0.48%), Belizean (6.4%, a difference of 0.48%), Immigrants from West Indies (6.3%, a difference of 0.60%), and Immigrants from Haiti (6.3%, a difference of 0.65%).
| Demographics | Rating | Rank | Unemployment |
| Spanish American Indians | 0.0 /100 | #294 | Tragic 6.2% |
| U.S. Virgin Islanders | 0.0 /100 | #295 | Tragic 6.3% |
| Ute | 0.0 /100 | #296 | Tragic 6.3% |
| Jamaicans | 0.0 /100 | #297 | Tragic 6.3% |
| Immigrants | Haiti | 0.0 /100 | #298 | Tragic 6.3% |
| Immigrants | West Indies | 0.0 /100 | #299 | Tragic 6.3% |
| Immigrants | Trinidad and Tobago | 0.0 /100 | #300 | Tragic 6.3% |
| Trinidadians and Tobagonians | 0.0 /100 | #301 | Tragic 6.3% |
| West Indians | 0.0 /100 | #302 | Tragic 6.4% |
| Belizeans | 0.0 /100 | #303 | Tragic 6.4% |
| Immigrants | Jamaica | 0.0 /100 | #304 | Tragic 6.4% |
| Menominee | 0.0 /100 | #305 | Tragic 6.4% |
| Lumbee | 0.0 /100 | #306 | Tragic 6.4% |
| Immigrants | Bangladesh | 0.0 /100 | #307 | Tragic 6.5% |
| Barbadians | 0.0 /100 | #308 | Tragic 6.5% |
Demographics Similar to Colombians by Unemployment
In terms of unemployment, the demographic groups most similar to Colombians are Immigrants from Indonesia (5.2%, a difference of 0.010%), Uruguayan (5.2%, a difference of 0.060%), Immigrants from Brazil (5.2%, a difference of 0.13%), Immigrants from Morocco (5.2%, a difference of 0.13%), and Immigrants from Zaire (5.2%, a difference of 0.24%).
| Demographics | Rating | Rank | Unemployment |
| Laotians | 66.3 /100 | #160 | Good 5.2% |
| Immigrants | Oceania | 65.2 /100 | #161 | Good 5.2% |
| Spanish | 65.1 /100 | #162 | Good 5.2% |
| Immigrants | Zaire | 64.7 /100 | #163 | Good 5.2% |
| Immigrants | Colombia | 64.7 /100 | #164 | Good 5.2% |
| Immigrants | Brazil | 63.1 /100 | #165 | Good 5.2% |
| Immigrants | Indonesia | 61.2 /100 | #166 | Good 5.2% |
| Colombians | 61.1 /100 | #167 | Good 5.2% |
| Uruguayans | 60.2 /100 | #168 | Good 5.2% |
| Immigrants | Morocco | 59.1 /100 | #169 | Average 5.2% |
| Immigrants | Nicaragua | 57.1 /100 | #170 | Average 5.2% |
| Puget Sound Salish | 56.6 /100 | #171 | Average 5.2% |
| Immigrants | Vietnam | 52.5 /100 | #172 | Average 5.2% |
| Immigrants | Poland | 51.8 /100 | #173 | Average 5.3% |
| Immigrants | Congo | 50.0 /100 | #174 | Average 5.3% |