Trinidadian and Tobagonian vs Basque Married-couple Households
COMPARE
Trinidadian and Tobagonian
Basque
Married-couple Households
Married-couple Households Comparison
Trinidadians and Tobagonians
Basques
40.9%
MARRIED-COUPLE HOUSEHOLDS
0.0/ 100
METRIC RATING
315th/ 347
METRIC RANK
48.4%
MARRIED-COUPLE HOUSEHOLDS
99.0/ 100
METRIC RATING
63rd/ 347
METRIC RANK
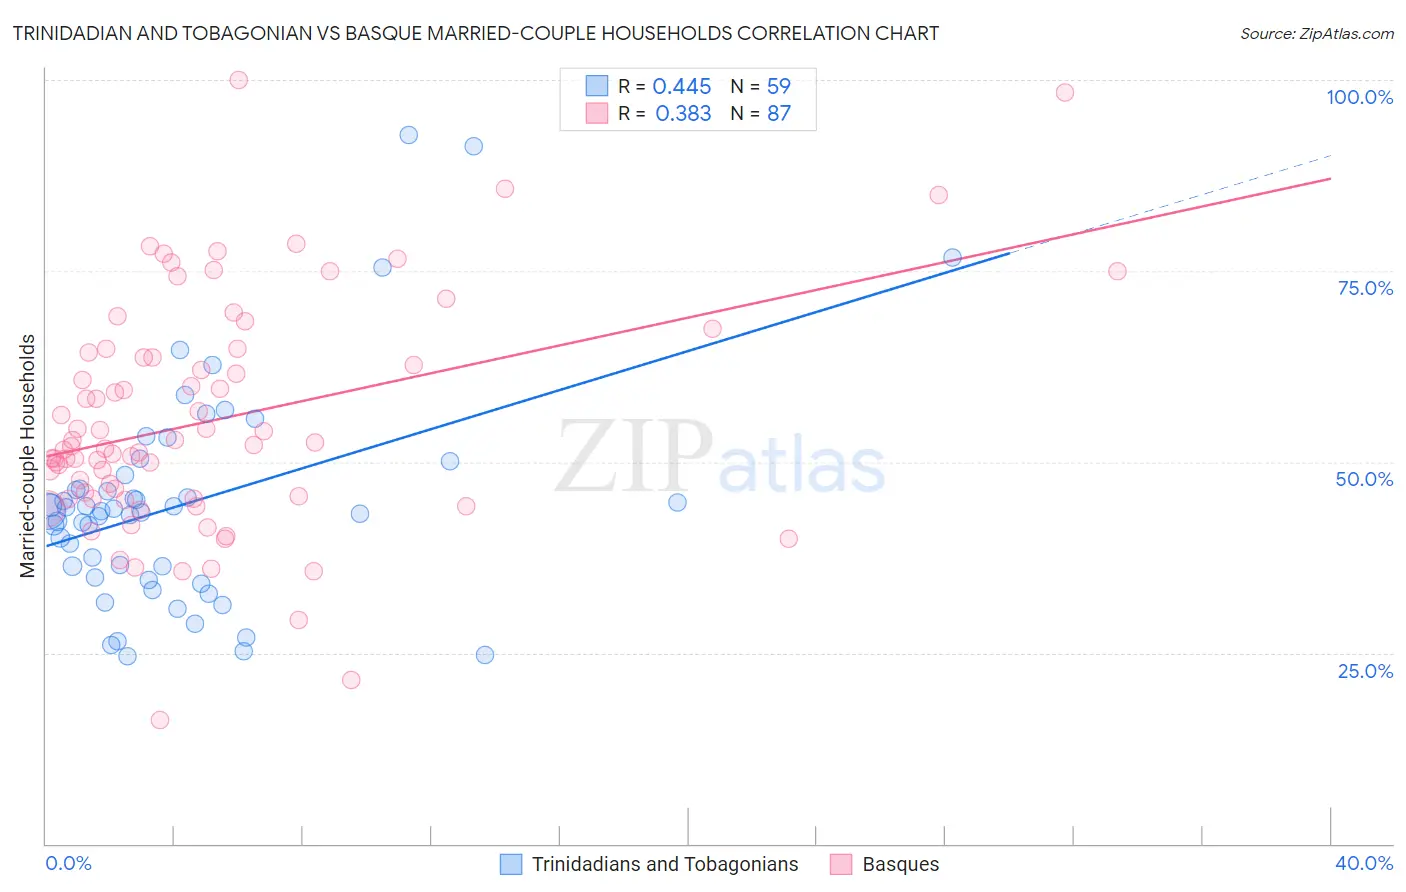
Trinidadian and Tobagonian vs Basque Married-couple Households Correlation Chart
The statistical analysis conducted on geographies consisting of 219,710,717 people shows a moderate positive correlation between the proportion of Trinidadians and Tobagonians and percentage of married-couple family households in the United States with a correlation coefficient (R) of 0.445 and weighted average of 40.9%. Similarly, the statistical analysis conducted on geographies consisting of 165,752,424 people shows a mild positive correlation between the proportion of Basques and percentage of married-couple family households in the United States with a correlation coefficient (R) of 0.383 and weighted average of 48.4%, a difference of 18.6%.
Married-couple Households Correlation Summary
| Measurement | Trinidadian and Tobagonian | Basque |
| Minimum | 24.5% | 16.3% |
| Maximum | 92.8% | 100.0% |
| Range | 68.3% | 83.7% |
| Mean | 44.6% | 55.5% |
| Median | 43.5% | 52.2% |
| Interquartile 25% (IQ1) | 34.9% | 45.2% |
| Interquartile 75% (IQ3) | 48.2% | 64.3% |
| Interquartile Range (IQR) | 13.3% | 19.1% |
| Standard Deviation (Sample) | 14.3% | 15.2% |
| Standard Deviation (Population) | 14.2% | 15.1% |
Similar Demographics by Married-couple Households
Demographics Similar to Trinidadians and Tobagonians by Married-couple Households
In terms of married-couple households, the demographic groups most similar to Trinidadians and Tobagonians are Jamaican (40.9%, a difference of 0.080%), Immigrants from Haiti (40.9%, a difference of 0.15%), Immigrants from Caribbean (40.8%, a difference of 0.18%), African (40.9%, a difference of 0.22%), and Colville (41.0%, a difference of 0.30%).
| Demographics | Rating | Rank | Married-couple Households |
| Crow | 0.0 /100 | #308 | Tragic 41.4% |
| Immigrants | Trinidad and Tobago | 0.0 /100 | #309 | Tragic 41.2% |
| Haitians | 0.0 /100 | #310 | Tragic 41.2% |
| Colville | 0.0 /100 | #311 | Tragic 41.0% |
| Africans | 0.0 /100 | #312 | Tragic 40.9% |
| Immigrants | Haiti | 0.0 /100 | #313 | Tragic 40.9% |
| Jamaicans | 0.0 /100 | #314 | Tragic 40.9% |
| Trinidadians and Tobagonians | 0.0 /100 | #315 | Tragic 40.9% |
| Immigrants | Caribbean | 0.0 /100 | #316 | Tragic 40.8% |
| Immigrants | Jamaica | 0.0 /100 | #317 | Tragic 40.7% |
| Liberians | 0.0 /100 | #318 | Tragic 40.7% |
| Bahamians | 0.0 /100 | #319 | Tragic 40.5% |
| West Indians | 0.0 /100 | #320 | Tragic 40.3% |
| Immigrants | Liberia | 0.0 /100 | #321 | Tragic 40.3% |
| Immigrants | Zaire | 0.0 /100 | #322 | Tragic 40.1% |
Demographics Similar to Basques by Married-couple Households
In terms of married-couple households, the demographic groups most similar to Basques are Northern European (48.4%, a difference of 0.010%), Immigrants from Canada (48.4%, a difference of 0.030%), Jordanian (48.4%, a difference of 0.050%), Luxembourger (48.5%, a difference of 0.060%), and Romanian (48.4%, a difference of 0.060%).
| Demographics | Rating | Rank | Married-couple Households |
| Immigrants | Northern Europe | 99.3 /100 | #56 | Exceptional 48.6% |
| Poles | 99.2 /100 | #57 | Exceptional 48.5% |
| Immigrants | Indonesia | 99.2 /100 | #58 | Exceptional 48.5% |
| Czechoslovakians | 99.2 /100 | #59 | Exceptional 48.5% |
| Croatians | 99.1 /100 | #60 | Exceptional 48.5% |
| Bulgarians | 99.1 /100 | #61 | Exceptional 48.5% |
| Luxembourgers | 99.1 /100 | #62 | Exceptional 48.5% |
| Basques | 99.0 /100 | #63 | Exceptional 48.4% |
| Northern Europeans | 99.0 /100 | #64 | Exceptional 48.4% |
| Immigrants | Canada | 99.0 /100 | #65 | Exceptional 48.4% |
| Jordanians | 98.9 /100 | #66 | Exceptional 48.4% |
| Romanians | 98.9 /100 | #67 | Exceptional 48.4% |
| Immigrants | South Eastern Asia | 98.9 /100 | #68 | Exceptional 48.4% |
| Immigrants | China | 98.9 /100 | #69 | Exceptional 48.4% |
| Immigrants | North America | 98.9 /100 | #70 | Exceptional 48.4% |