Tohono O'odham vs Tlingit-Haida Single Father Households
COMPARE
Tohono O'odham
Tlingit-Haida
Single Father Households
Single Father Households Comparison
Tohono O'odham
Tlingit-Haida
3.8%
SINGLE FATHER HOUSEHOLDS
0.0/ 100
METRIC RATING
342nd/ 347
METRIC RANK
2.7%
SINGLE FATHER HOUSEHOLDS
0.0/ 100
METRIC RATING
289th/ 347
METRIC RANK
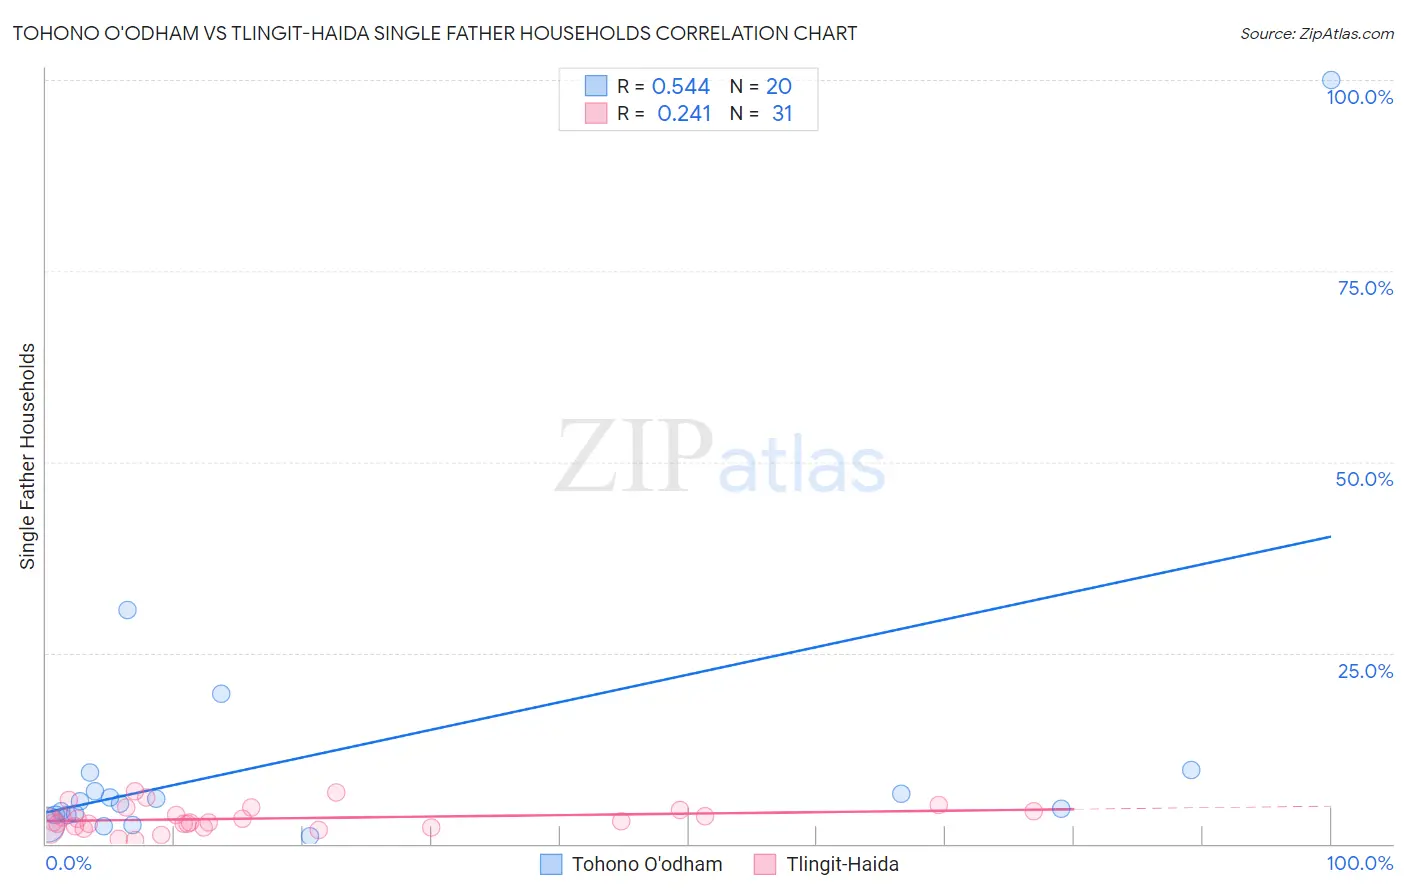
Tohono O'odham vs Tlingit-Haida Single Father Households Correlation Chart
The statistical analysis conducted on geographies consisting of 58,632,927 people shows a substantial positive correlation between the proportion of Tohono O'odham and percentage of single father households in the United States with a correlation coefficient (R) of 0.544 and weighted average of 3.8%. Similarly, the statistical analysis conducted on geographies consisting of 60,729,668 people shows a weak positive correlation between the proportion of Tlingit-Haida and percentage of single father households in the United States with a correlation coefficient (R) of 0.241 and weighted average of 2.7%, a difference of 42.9%.
Single Father Households Correlation Summary
| Measurement | Tohono O'odham | Tlingit-Haida |
| Minimum | 1.0% | 0.49% |
| Maximum | 100.0% | 6.9% |
| Range | 99.0% | 6.5% |
| Mean | 11.7% | 3.3% |
| Median | 5.4% | 2.8% |
| Interquartile 25% (IQ1) | 3.8% | 2.4% |
| Interquartile 75% (IQ3) | 8.1% | 4.5% |
| Interquartile Range (IQR) | 4.3% | 2.1% |
| Standard Deviation (Sample) | 21.9% | 1.6% |
| Standard Deviation (Population) | 21.3% | 1.6% |
Similar Demographics by Single Father Households
Demographics Similar to Tohono O'odham by Single Father Households
In terms of single father households, the demographic groups most similar to Tohono O'odham are Crow (3.5%, a difference of 8.8%), Alaska Native (3.5%, a difference of 9.1%), Pima (4.2%, a difference of 9.2%), Yakama (4.2%, a difference of 9.5%), and Menominee (4.2%, a difference of 10.2%).
| Demographics | Rating | Rank | Single Father Households |
| Natives/Alaskans | 0.0 /100 | #333 | Tragic 3.2% |
| Yuman | 0.0 /100 | #334 | Tragic 3.3% |
| Colville | 0.0 /100 | #335 | Tragic 3.3% |
| Paiute | 0.0 /100 | #336 | Tragic 3.3% |
| Pueblo | 0.0 /100 | #337 | Tragic 3.3% |
| Sioux | 0.0 /100 | #338 | Tragic 3.3% |
| Alaskan Athabascans | 0.0 /100 | #339 | Tragic 3.4% |
| Alaska Natives | 0.0 /100 | #340 | Tragic 3.5% |
| Crow | 0.0 /100 | #341 | Tragic 3.5% |
| Tohono O'odham | 0.0 /100 | #342 | Tragic 3.8% |
| Pima | 0.0 /100 | #343 | Tragic 4.2% |
| Yakama | 0.0 /100 | #344 | Tragic 4.2% |
| Menominee | 0.0 /100 | #345 | Tragic 4.2% |
| Inupiat | 0.0 /100 | #346 | Tragic 4.9% |
| Yup'ik | 0.0 /100 | #347 | Tragic 5.4% |
Demographics Similar to Tlingit-Haida by Single Father Households
In terms of single father households, the demographic groups most similar to Tlingit-Haida are Immigrants from Cambodia (2.7%, a difference of 0.060%), Central American Indian (2.7%, a difference of 0.31%), Puget Sound Salish (2.7%, a difference of 0.45%), Ottawa (2.7%, a difference of 0.47%), and Immigrants from Cuba (2.7%, a difference of 0.47%).
| Demographics | Rating | Rank | Single Father Households |
| Dutch West Indians | 0.1 /100 | #282 | Tragic 2.6% |
| Immigrants | Nicaragua | 0.1 /100 | #283 | Tragic 2.7% |
| Hawaiians | 0.1 /100 | #284 | Tragic 2.7% |
| Ottawa | 0.1 /100 | #285 | Tragic 2.7% |
| Immigrants | Cuba | 0.1 /100 | #286 | Tragic 2.7% |
| Central American Indians | 0.0 /100 | #287 | Tragic 2.7% |
| Immigrants | Cambodia | 0.0 /100 | #288 | Tragic 2.7% |
| Tlingit-Haida | 0.0 /100 | #289 | Tragic 2.7% |
| Puget Sound Salish | 0.0 /100 | #290 | Tragic 2.7% |
| Blackfeet | 0.0 /100 | #291 | Tragic 2.7% |
| Choctaw | 0.0 /100 | #292 | Tragic 2.7% |
| Immigrants | Fiji | 0.0 /100 | #293 | Tragic 2.7% |
| Malaysians | 0.0 /100 | #294 | Tragic 2.7% |
| Chickasaw | 0.0 /100 | #295 | Tragic 2.8% |
| Japanese | 0.0 /100 | #296 | Tragic 2.8% |