Immigrants from Indonesia vs Immigrants from St. Vincent and the Grenadines Family Households with Children
COMPARE
Immigrants from Indonesia
Immigrants from St. Vincent and the Grenadines
Family Households with Children
Family Households with Children Comparison
Immigrants from Indonesia
Immigrants from St. Vincent and the Grenadines
28.5%
FAMILY HOUSEHOLDS WITH CHILDREN
99.9/ 100
METRIC RATING
72nd/ 347
METRIC RANK
25.6%
FAMILY HOUSEHOLDS WITH CHILDREN
0.0/ 100
METRIC RATING
339th/ 347
METRIC RANK
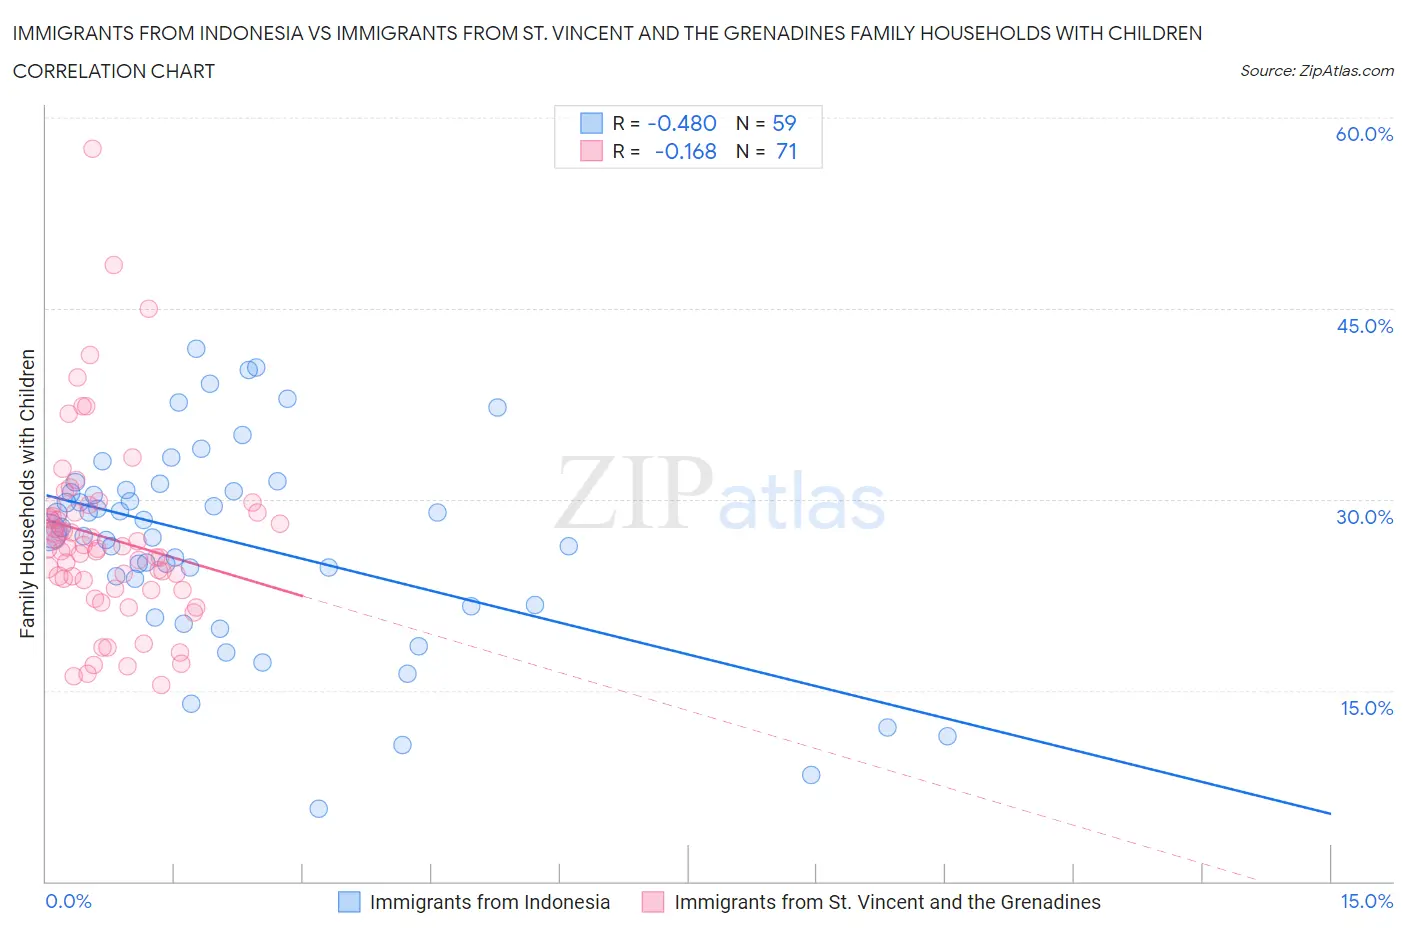
Immigrants from Indonesia vs Immigrants from St. Vincent and the Grenadines Family Households with Children Correlation Chart
The statistical analysis conducted on geographies consisting of 215,654,509 people shows a moderate negative correlation between the proportion of Immigrants from Indonesia and percentage of family households with children in the United States with a correlation coefficient (R) of -0.480 and weighted average of 28.5%. Similarly, the statistical analysis conducted on geographies consisting of 56,180,782 people shows a poor negative correlation between the proportion of Immigrants from St. Vincent and the Grenadines and percentage of family households with children in the United States with a correlation coefficient (R) of -0.168 and weighted average of 25.6%, a difference of 11.5%.
Family Households with Children Correlation Summary
| Measurement | Immigrants from Indonesia | Immigrants from St. Vincent and the Grenadines |
| Minimum | 5.7% | 15.4% |
| Maximum | 41.8% | 57.6% |
| Range | 36.1% | 42.2% |
| Mean | 26.6% | 27.0% |
| Median | 27.4% | 26.1% |
| Interquartile 25% (IQ1) | 21.7% | 23.0% |
| Interquartile 75% (IQ3) | 30.8% | 29.0% |
| Interquartile Range (IQR) | 9.0% | 6.0% |
| Standard Deviation (Sample) | 8.0% | 7.4% |
| Standard Deviation (Population) | 7.9% | 7.3% |
Similar Demographics by Family Households with Children
Demographics Similar to Immigrants from Indonesia by Family Households with Children
In terms of family households with children, the demographic groups most similar to Immigrants from Indonesia are Burmese (28.5%, a difference of 0.010%), Immigrants from Honduras (28.5%, a difference of 0.020%), Iraqi (28.5%, a difference of 0.030%), Laotian (28.5%, a difference of 0.040%), and Immigrants from Korea (28.5%, a difference of 0.080%).
| Demographics | Rating | Rank | Family Households with Children |
| Hondurans | 99.9 /100 | #65 | Exceptional 28.5% |
| Immigrants | Egypt | 99.9 /100 | #66 | Exceptional 28.5% |
| Ghanaians | 99.9 /100 | #67 | Exceptional 28.5% |
| Houma | 99.9 /100 | #68 | Exceptional 28.5% |
| Immigrants | Korea | 99.9 /100 | #69 | Exceptional 28.5% |
| Immigrants | Honduras | 99.9 /100 | #70 | Exceptional 28.5% |
| Burmese | 99.9 /100 | #71 | Exceptional 28.5% |
| Immigrants | Indonesia | 99.9 /100 | #72 | Exceptional 28.5% |
| Iraqis | 99.9 /100 | #73 | Exceptional 28.5% |
| Laotians | 99.9 /100 | #74 | Exceptional 28.5% |
| Immigrants | Jordan | 99.9 /100 | #75 | Exceptional 28.4% |
| Immigrants | Sri Lanka | 99.9 /100 | #76 | Exceptional 28.4% |
| Nigerians | 99.8 /100 | #77 | Exceptional 28.4% |
| Immigrants | Nepal | 99.8 /100 | #78 | Exceptional 28.4% |
| Immigrants | Iraq | 99.8 /100 | #79 | Exceptional 28.4% |
Demographics Similar to Immigrants from St. Vincent and the Grenadines by Family Households with Children
In terms of family households with children, the demographic groups most similar to Immigrants from St. Vincent and the Grenadines are Arapaho (25.6%, a difference of 0.010%), Puerto Rican (25.6%, a difference of 0.040%), Immigrants from Armenia (25.6%, a difference of 0.040%), Immigrants from Serbia (25.5%, a difference of 0.42%), and Immigrants from West Indies (25.7%, a difference of 0.43%).
| Demographics | Rating | Rank | Family Households with Children |
| Immigrants | Austria | 0.0 /100 | #332 | Tragic 25.8% |
| Immigrants | Switzerland | 0.0 /100 | #333 | Tragic 25.7% |
| Slovaks | 0.0 /100 | #334 | Tragic 25.7% |
| Immigrants | Croatia | 0.0 /100 | #335 | Tragic 25.7% |
| Immigrants | West Indies | 0.0 /100 | #336 | Tragic 25.7% |
| Puerto Ricans | 0.0 /100 | #337 | Tragic 25.6% |
| Arapaho | 0.0 /100 | #338 | Tragic 25.6% |
| Immigrants | St. Vincent and the Grenadines | 0.0 /100 | #339 | Tragic 25.6% |
| Immigrants | Armenia | 0.0 /100 | #340 | Tragic 25.6% |
| Immigrants | Serbia | 0.0 /100 | #341 | Tragic 25.5% |
| Alsatians | 0.0 /100 | #342 | Tragic 25.3% |
| Hopi | 0.0 /100 | #343 | Tragic 25.2% |
| Pueblo | 0.0 /100 | #344 | Tragic 25.2% |
| Immigrants | Grenada | 0.0 /100 | #345 | Tragic 25.2% |
| Carpatho Rusyns | 0.0 /100 | #346 | Tragic 25.2% |