Thai vs Immigrants from Armenia Family Households
COMPARE
Thai
Immigrants from Armenia
Family Households
Family Households Comparison
Thais
Immigrants from Armenia
67.2%
FAMILY HOUSEHOLDS
100.0/ 100
METRIC RATING
34th/ 347
METRIC RANK
63.5%
FAMILY HOUSEHOLDS
2.6/ 100
METRIC RATING
233rd/ 347
METRIC RANK
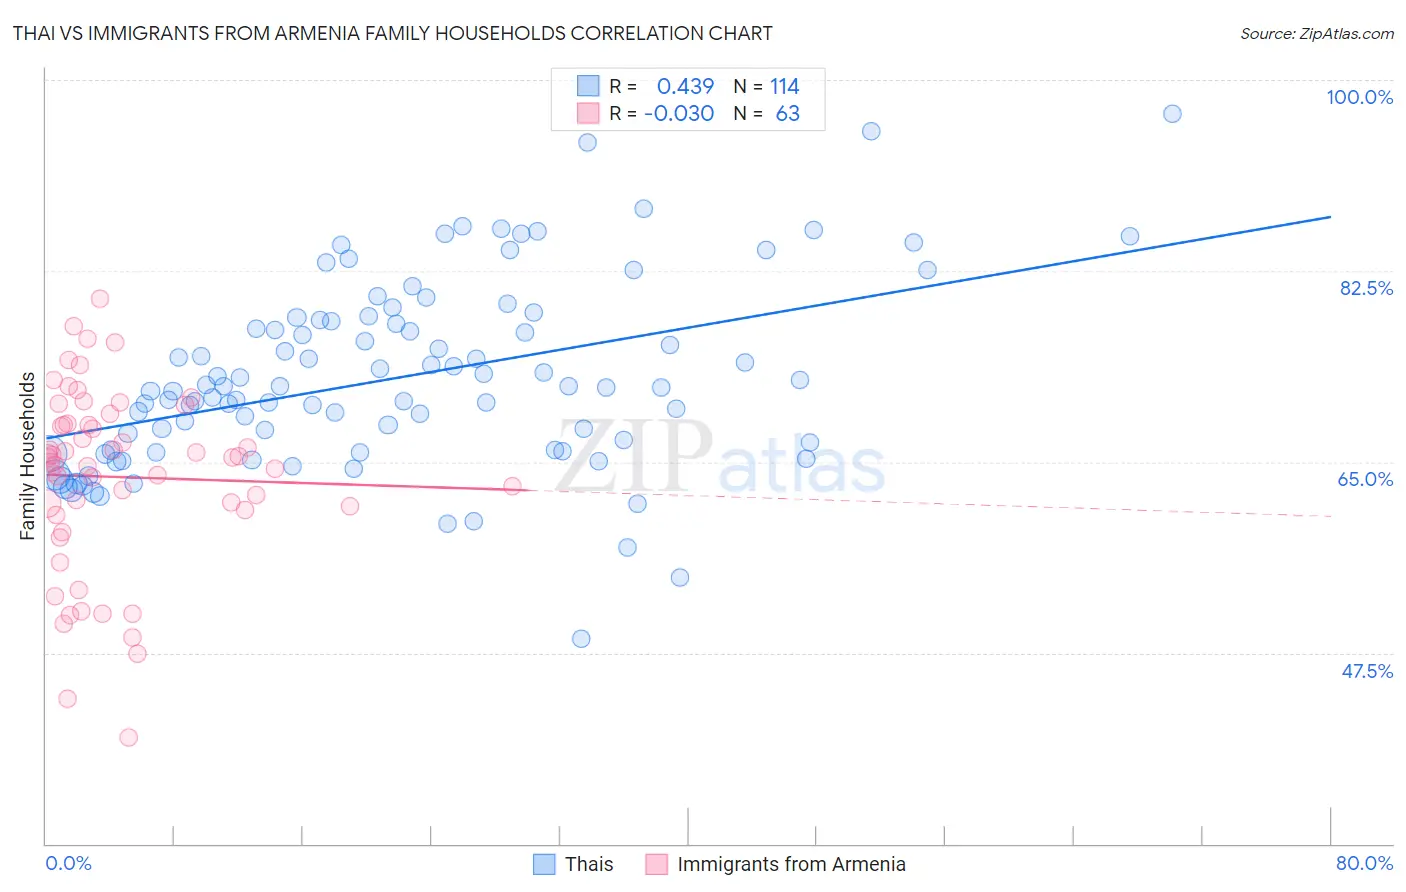
Thai vs Immigrants from Armenia Family Households Correlation Chart
The statistical analysis conducted on geographies consisting of 475,372,793 people shows a moderate positive correlation between the proportion of Thais and percentage of family households in the United States with a correlation coefficient (R) of 0.439 and weighted average of 67.2%. Similarly, the statistical analysis conducted on geographies consisting of 97,683,198 people shows no correlation between the proportion of Immigrants from Armenia and percentage of family households in the United States with a correlation coefficient (R) of -0.030 and weighted average of 63.5%, a difference of 5.8%.
Family Households Correlation Summary
| Measurement | Thai | Immigrants from Armenia |
| Minimum | 48.8% | 39.7% |
| Maximum | 97.0% | 79.9% |
| Range | 48.2% | 40.2% |
| Mean | 72.7% | 63.6% |
| Median | 71.8% | 65.3% |
| Interquartile 25% (IQ1) | 66.1% | 60.6% |
| Interquartile 75% (IQ3) | 77.9% | 68.5% |
| Interquartile Range (IQR) | 11.8% | 7.9% |
| Standard Deviation (Sample) | 8.6% | 8.3% |
| Standard Deviation (Population) | 8.5% | 8.3% |
Similar Demographics by Family Households
Demographics Similar to Thais by Family Households
In terms of family households, the demographic groups most similar to Thais are Salvadoran (67.2%, a difference of 0.0%), Nepalese (67.2%, a difference of 0.040%), Tohono O'odham (67.1%, a difference of 0.050%), Peruvian (67.1%, a difference of 0.060%), and Immigrants from Latin America (67.2%, a difference of 0.10%).
| Demographics | Rating | Rank | Family Households |
| Hispanics or Latinos | 100.0 /100 | #27 | Exceptional 67.4% |
| Hawaiians | 100.0 /100 | #28 | Exceptional 67.4% |
| Nicaraguans | 100.0 /100 | #29 | Exceptional 67.4% |
| Immigrants | Peru | 100.0 /100 | #30 | Exceptional 67.2% |
| Immigrants | Latin America | 100.0 /100 | #31 | Exceptional 67.2% |
| Nepalese | 100.0 /100 | #32 | Exceptional 67.2% |
| Salvadorans | 100.0 /100 | #33 | Exceptional 67.2% |
| Thais | 100.0 /100 | #34 | Exceptional 67.2% |
| Tohono O'odham | 100.0 /100 | #35 | Exceptional 67.1% |
| Peruvians | 100.0 /100 | #36 | Exceptional 67.1% |
| Tsimshian | 100.0 /100 | #37 | Exceptional 67.1% |
| Mexican American Indians | 100.0 /100 | #38 | Exceptional 67.0% |
| Immigrants | El Salvador | 100.0 /100 | #39 | Exceptional 67.0% |
| Guamanians/Chamorros | 100.0 /100 | #40 | Exceptional 66.6% |
| Immigrants | Bolivia | 100.0 /100 | #41 | Exceptional 66.6% |
Demographics Similar to Immigrants from Armenia by Family Households
In terms of family households, the demographic groups most similar to Immigrants from Armenia are Immigrants from Northern Africa (63.5%, a difference of 0.010%), Finnish (63.5%, a difference of 0.030%), Immigrants from Greece (63.5%, a difference of 0.050%), Albanian (63.5%, a difference of 0.050%), and Immigrants from Brazil (63.6%, a difference of 0.060%).
| Demographics | Rating | Rank | Family Households |
| Immigrants | Bahamas | 4.2 /100 | #226 | Tragic 63.6% |
| Trinidadians and Tobagonians | 4.1 /100 | #227 | Tragic 63.6% |
| Blackfeet | 3.6 /100 | #228 | Tragic 63.6% |
| Bulgarians | 3.4 /100 | #229 | Tragic 63.6% |
| Immigrants | Brazil | 3.0 /100 | #230 | Tragic 63.6% |
| Immigrants | Greece | 2.9 /100 | #231 | Tragic 63.5% |
| Immigrants | Northern Africa | 2.6 /100 | #232 | Tragic 63.5% |
| Immigrants | Armenia | 2.6 /100 | #233 | Tragic 63.5% |
| Finns | 2.3 /100 | #234 | Tragic 63.5% |
| Albanians | 2.2 /100 | #235 | Tragic 63.5% |
| Ghanaians | 2.1 /100 | #236 | Tragic 63.5% |
| Comanche | 2.1 /100 | #237 | Tragic 63.5% |
| Immigrants | Zimbabwe | 2.0 /100 | #238 | Tragic 63.5% |
| Aleuts | 1.9 /100 | #239 | Tragic 63.4% |
| South Africans | 1.9 /100 | #240 | Tragic 63.4% |