Taiwanese vs Egyptian Divorced or Separated

COMPARE

Taiwanese
Race
Ancestry
AfghanAfricanAlaska NativeAlaskan AthabascanAlbanianAleutAlsatianAmericanApacheArabArapahoArgentineanArmenianAssyrian/Chaldean/SyriacAustralianAustrianBahamianBangladeshiBarbadianBasqueBelgianBelizeanBermudanBhutaneseBlackfeetBolivianBrazilianBritishBritish West IndianBulgarianBurmeseCajunCambodianCanadianCape VerdeanCarpatho RusynCelticCentral AmericanCentral American IndianCherokeeCheyenneChickasawChileanChineseChippewaChoctawColombianColvilleComancheCosta RicanCreeCreekCroatianCrowCubanCypriotCzechCzechoslovakianDanishDelawareDominicanDutchDutch West IndianEastern EuropeanEcuadorianEnglishEstonianEthiopianEuropeanFijianFilipinoFinnishFrenchFrench American IndianFrench CanadianGermanGerman RussianGhanaianGreekGuamanian/ChamorroGuatemalanGuyaneseHaitianHmongHonduranHopiHoumaHungarianIcelanderIndian (Asian)IndonesianInupiatIranianIraqiIrishIroquoisIsraeliItalianJamaicanJapaneseJordanianKenyanKiowaKoreanLaotianLatvianLebaneseLiberianLithuanianLumbeeLuxembourgerMacedonianMalaysianMalteseMarshalleseMenomineeMexicanMexican American IndianMongolianMoroccanNative HawaiianNavajoNepaleseNew ZealanderNicaraguanNigerianNorthern EuropeanNorwegianOkinawanOsageOttawaPaiutePakistaniPalestinianPanamanianParaguayanPennsylvania GermanPeruvianPimaPolishPortuguesePotawatomiPuebloPuerto RicanPuget Sound SalishRomanianRussianSalvadoranSamoanScandinavianScotch-IrishScottishSeminoleSenegaleseSerbianShoshoneSierra LeoneanSiouxSlavicSlovakSloveneSomaliSouth AfricanSouth AmericanSouth American IndianSoviet UnionSpaniardSpanishSpanish AmericanSpanish American IndianSri LankanSubsaharan AfricanSudaneseSwedishSwissSyrianTaiwaneseThaiTlingit-HaidaTohono O'OdhamTonganTrinidadian and TobagonianTsimshianTurkishU.S. Virgin IslanderUgandanUkrainianUruguayanUteVenezuelanVietnameseWelshWest IndianYakamaYaquiYugoslavianYumanYup'ikZimbabwean
Immigration
NonimmigrantsImmigrantsAfghanistanAfricaAlbaniaArgentinaArmeniaAsiaAustraliaAustriaBahamasBangladeshBarbadosBelarusBelgiumBelizeBoliviaBosnia and HerzegovinaBrazilBulgariaBurma/MyanmarCabo VerdeCambodiaCameroonCanadaCaribbeanCentral AmericaChileChinaColombiaCongoCosta RicaCroatiaCubaCzechoslovakiaDenmarkDominicaDominican RepublicEastern AfricaEastern AsiaEastern EuropeEcuadorEgyptEl SalvadorEnglandEritreaEthiopiaEuropeFijiFranceGermanyGhanaGreeceGrenadaGuatemalaGuyanaHaitiHondurasHong KongHungaryIndiaIndonesiaIranIraqIrelandIsraelItalyJamaicaJapanJordanKazakhstanKenyaKoreaKuwaitLaosLatin AmericaLatviaLebanonLiberiaLithuaniaMalaysiaMexicoMicronesiaMiddle AfricaMoldovaMoroccoNepalNetherlandsNicaraguaNigeriaNorth AmericaNorth MacedoniaNorthern AfricaNorthern EuropeNorwayOceaniaPakistanPanamaPeruPhilippinesPolandPortugalRomaniaRussiaSaudi ArabiaScotlandSenegalSerbiaSierra LeoneSingaporeSomaliaSouth AfricaSouth AmericaSouth Central AsiaSouth Eastern AsiaSouthern EuropeSpainSri LankaSt. Vincent and the GrenadinesSudanSwedenSwitzerlandSyriaTaiwanThailandTrinidad and TobagoTurkeyUgandaUkraineUruguayUzbekistanVenezuelaVietnamWest IndiesWestern AfricaWestern AsiaWestern EuropeYemenZaireZimbabweAzores
Egyptian
Race
Ancestry
AfghanAfricanAlaska NativeAlaskan AthabascanAlbanianAleutAlsatianAmericanApacheArabArapahoArgentineanArmenianAssyrian/Chaldean/SyriacAustralianAustrianBahamianBangladeshiBarbadianBasqueBelgianBelizeanBermudanBhutaneseBlackfeetBolivianBrazilianBritishBritish West IndianBulgarianBurmeseCajunCambodianCanadianCape VerdeanCarpatho RusynCelticCentral AmericanCentral American IndianCherokeeCheyenneChickasawChileanChineseChippewaChoctawColombianColvilleComancheCosta RicanCreeCreekCroatianCrowCubanCypriotCzechCzechoslovakianDanishDelawareDominicanDutchDutch West IndianEastern EuropeanEcuadorianEgyptianEnglishEstonianEthiopianEuropeanFijianFilipinoFinnishFrenchFrench American IndianFrench CanadianGermanGerman RussianGhanaianGreekGuamanian/ChamorroGuatemalanGuyaneseHaitianHmongHonduranHopiHoumaHungarianIcelanderIndian (Asian)IndonesianInupiatIranianIraqiIrishIroquoisIsraeliItalianJamaicanJapaneseJordanianKenyanKiowaKoreanLaotianLatvianLebaneseLiberianLithuanianLumbeeLuxembourgerMacedonianMalaysianMalteseMarshalleseMenomineeMexicanMexican American IndianMongolianMoroccanNative HawaiianNavajoNepaleseNew ZealanderNicaraguanNigerianNorthern EuropeanNorwegianOkinawanOsageOttawaPaiutePakistaniPalestinianPanamanianParaguayanPennsylvania GermanPeruvianPimaPolishPortuguesePotawatomiPuebloPuerto RicanPuget Sound SalishRomanianRussianSalvadoranSamoanScandinavianScotch-IrishScottishSeminoleSenegaleseSerbianShoshoneSierra LeoneanSiouxSlavicSlovakSloveneSomaliSouth AfricanSouth AmericanSouth American IndianSoviet UnionSpaniardSpanishSpanish AmericanSpanish American IndianSri LankanSubsaharan AfricanSudaneseSwedishSwissSyrianThaiTlingit-HaidaTohono O'OdhamTonganTrinidadian and TobagonianTsimshianTurkishU.S. Virgin IslanderUgandanUkrainianUruguayanUteVenezuelanVietnameseWelshWest IndianYakamaYaquiYugoslavianYumanYup'ikZimbabwean
Immigration
NonimmigrantsImmigrantsAfghanistanAfricaAlbaniaArgentinaArmeniaAsiaAustraliaAustriaBahamasBangladeshBarbadosBelarusBelgiumBelizeBoliviaBosnia and HerzegovinaBrazilBulgariaBurma/MyanmarCabo VerdeCambodiaCameroonCanadaCaribbeanCentral AmericaChileChinaColombiaCongoCosta RicaCroatiaCubaCzechoslovakiaDenmarkDominicaDominican RepublicEastern AfricaEastern AsiaEastern EuropeEcuadorEgyptEl SalvadorEnglandEritreaEthiopiaEuropeFijiFranceGermanyGhanaGreeceGrenadaGuatemalaGuyanaHaitiHondurasHong KongHungaryIndiaIndonesiaIranIraqIrelandIsraelItalyJamaicaJapanJordanKazakhstanKenyaKoreaKuwaitLaosLatin AmericaLatviaLebanonLiberiaLithuaniaMalaysiaMexicoMicronesiaMiddle AfricaMoldovaMoroccoNepalNetherlandsNicaraguaNigeriaNorth AmericaNorth MacedoniaNorthern AfricaNorthern EuropeNorwayOceaniaPakistanPanamaPeruPhilippinesPolandPortugalRomaniaRussiaSaudi ArabiaScotlandSenegalSerbiaSierra LeoneSingaporeSomaliaSouth AfricaSouth AmericaSouth Central AsiaSouth Eastern AsiaSouthern EuropeSpainSri LankaSt. Vincent and the GrenadinesSudanSwedenSwitzerlandSyriaTaiwanThailandTrinidad and TobagoTurkeyUgandaUkraineUruguayUzbekistanVenezuelaVietnamWest IndiesWestern AfricaWestern AsiaWestern EuropeYemenZaireZimbabweAzores
Divorced or Separated
Income
Poverty
Unemployment
Labor Participation
Family Structure
Vehicle Availability
Education Level
Disability

Divorced or Separated Comparison

Taiwanese

Egyptians

Exceptional
Exceptional
11.5%
DIVORCED OR SEPARATED
99.6/ 100
METRIC RATING
74th/ 347
METRIC RANK
11.1%
DIVORCED OR SEPARATED
100.0/ 100
METRIC RATING
33rd/ 347
METRIC RANK

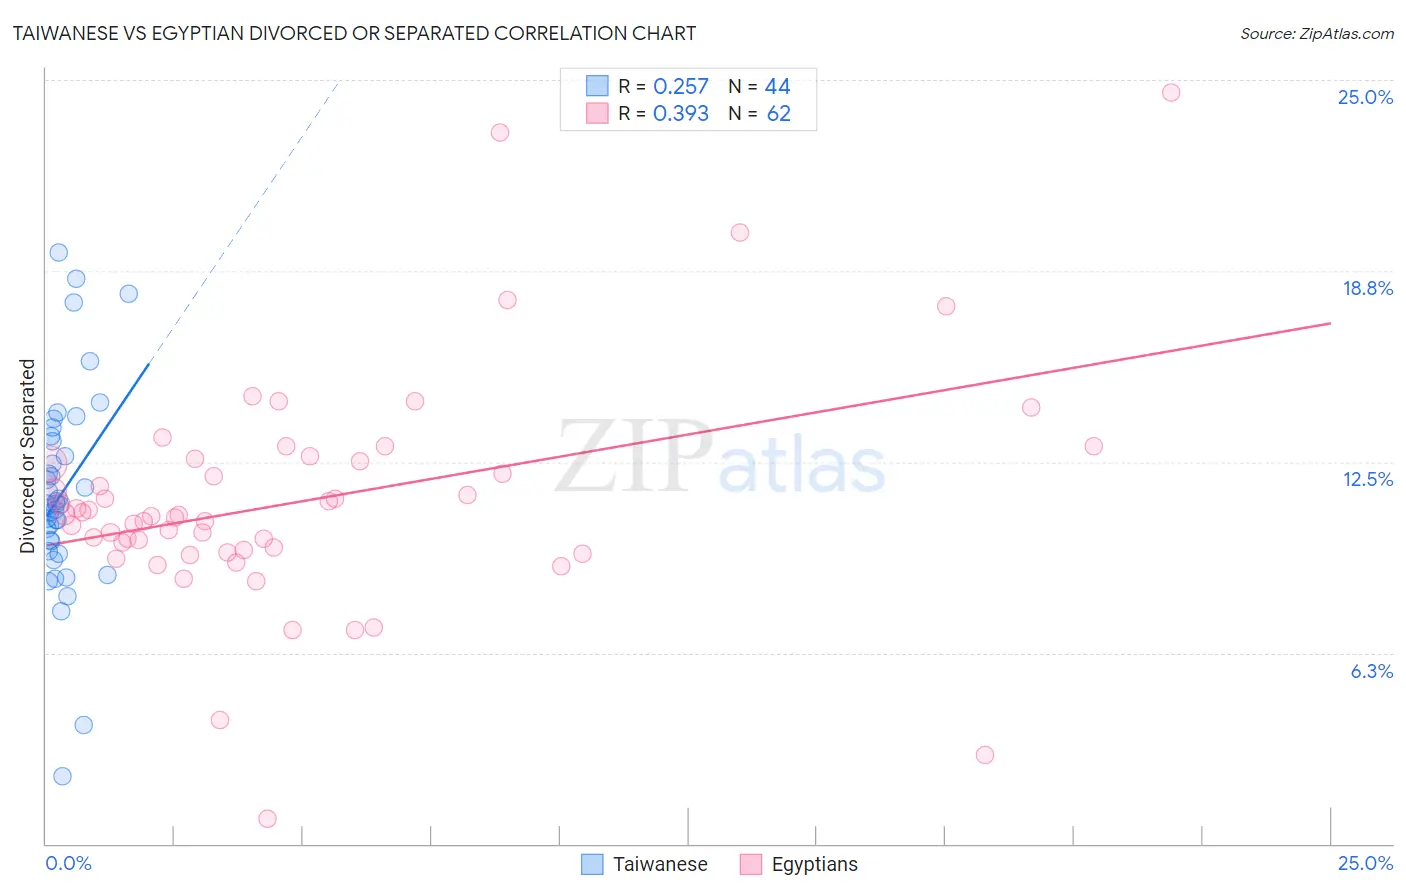
Taiwanese vs Egyptian Divorced or Separated Correlation Chart

The statistical analysis conducted on geographies consisting of 31,709,765 people shows a weak positive correlation between the proportion of Taiwanese and percentage of population currently divorced or separated in the United States with a correlation coefficient (R) of 0.257 and weighted average of 11.5%. Similarly, the statistical analysis conducted on geographies consisting of 276,808,669 people shows a mild positive correlation between the proportion of Egyptians and percentage of population currently divorced or separated in the United States with a correlation coefficient (R) of 0.393 and weighted average of 11.1%, a difference of 3.6%.
Taiwanese vs Egyptian Divorced or Separated

Divorced or Separated Correlation Summary

MeasurementTaiwaneseEgyptian
Minimum2.2%0.80%
Maximum19.3%24.6%
Range17.1%23.8%
Mean11.5%11.2%
Median11.1%10.8%
Interquartile 25% (IQ1)9.7%9.6%
Interquartile 75% (IQ3)13.3%12.5%
Interquartile Range (IQR)3.5%2.9%
Standard Deviation (Sample)3.3%3.8%
Standard Deviation (Population)3.3%3.8%

Similar Demographics by Divorced or Separated

Demographics Similar to Taiwanese by Divorced or Separated

In terms of divorced or separated, the demographic groups most similar to Taiwanese are Jordanian (11.5%, a difference of 0.060%), Immigrants from North Macedonia (11.5%, a difference of 0.060%), Immigrants from Northern Africa (11.5%, a difference of 0.080%), Albanian (11.5%, a difference of 0.10%), and Paraguayan (11.5%, a difference of 0.13%).
DemographicsRating | RankDivorced or Separated
Immigrants | Syria
99.7
/100
|
#67
Exceptional
11.4%
Palestinians
99.7
/100
|
#68
Exceptional
11.5%
Immigrants | Belgium
99.7
/100
|
#69
Exceptional
11.5%
Immigrants | Eastern Europe
99.7
/100
|
#70
Exceptional
11.5%
Paraguayans
99.7
/100
|
#71
Exceptional
11.5%
Jordanians
99.6
/100
|
#72
Exceptional
11.5%
Immigrants | North Macedonia
99.6
/100
|
#73
Exceptional
11.5%
Taiwanese
99.6
/100
|
#74
Exceptional
11.5%
Immigrants | Northern Africa
99.6
/100
|
#75
Exceptional
11.5%
Albanians
99.6
/100
|
#76
Exceptional
11.5%
Immigrants | Italy
99.5
/100
|
#77
Exceptional
11.5%
Afghans
99.4
/100
|
#78
Exceptional
11.5%
Guyanese
99.4
/100
|
#79
Exceptional
11.5%
Immigrants | Switzerland
99.4
/100
|
#80
Exceptional
11.5%
Russians
99.4
/100
|
#81
Exceptional
11.5%

Demographics Similar to Egyptians by Divorced or Separated

In terms of divorced or separated, the demographic groups most similar to Egyptians are Tongan (11.1%, a difference of 0.040%), Immigrants from Uzbekistan (11.1%, a difference of 0.070%), Mongolian (11.1%, a difference of 0.12%), Cambodian (11.1%, a difference of 0.15%), and Immigrants from Japan (11.1%, a difference of 0.21%).
DemographicsRating | RankDivorced or Separated
Immigrants | Indonesia
100.0
/100
|
#26
Exceptional
10.9%
Immigrants | Bangladesh
100.0
/100
|
#27
Exceptional
11.0%
Immigrants | Malaysia
100.0
/100
|
#28
Exceptional
11.0%
Armenians
100.0
/100
|
#29
Exceptional
11.0%
Immigrants | Ireland
100.0
/100
|
#30
Exceptional
11.0%
Mongolians
100.0
/100
|
#31
Exceptional
11.1%
Tongans
100.0
/100
|
#32
Exceptional
11.1%
Egyptians
100.0
/100
|
#33
Exceptional
11.1%
Immigrants | Uzbekistan
100.0
/100
|
#34
Exceptional
11.1%
Cambodians
100.0
/100
|
#35
Exceptional
11.1%
Immigrants | Japan
100.0
/100
|
#36
Exceptional
11.1%
Immigrants | Lebanon
100.0
/100
|
#37
Exceptional
11.1%
Immigrants | Greece
100.0
/100
|
#38
Exceptional
11.1%
Immigrants | Egypt
100.0
/100
|
#39
Exceptional
11.1%
Soviet Union
100.0
/100
|
#40
Exceptional
11.1%