Taiwanese vs Menominee Divorced or Separated
COMPARE
Taiwanese
Menominee
Divorced or Separated
Divorced or Separated Comparison
Taiwanese
Menominee
11.5%
DIVORCED OR SEPARATED
99.6/ 100
METRIC RATING
74th/ 347
METRIC RANK
11.8%
DIVORCED OR SEPARATED
93.8/ 100
METRIC RATING
122nd/ 347
METRIC RANK
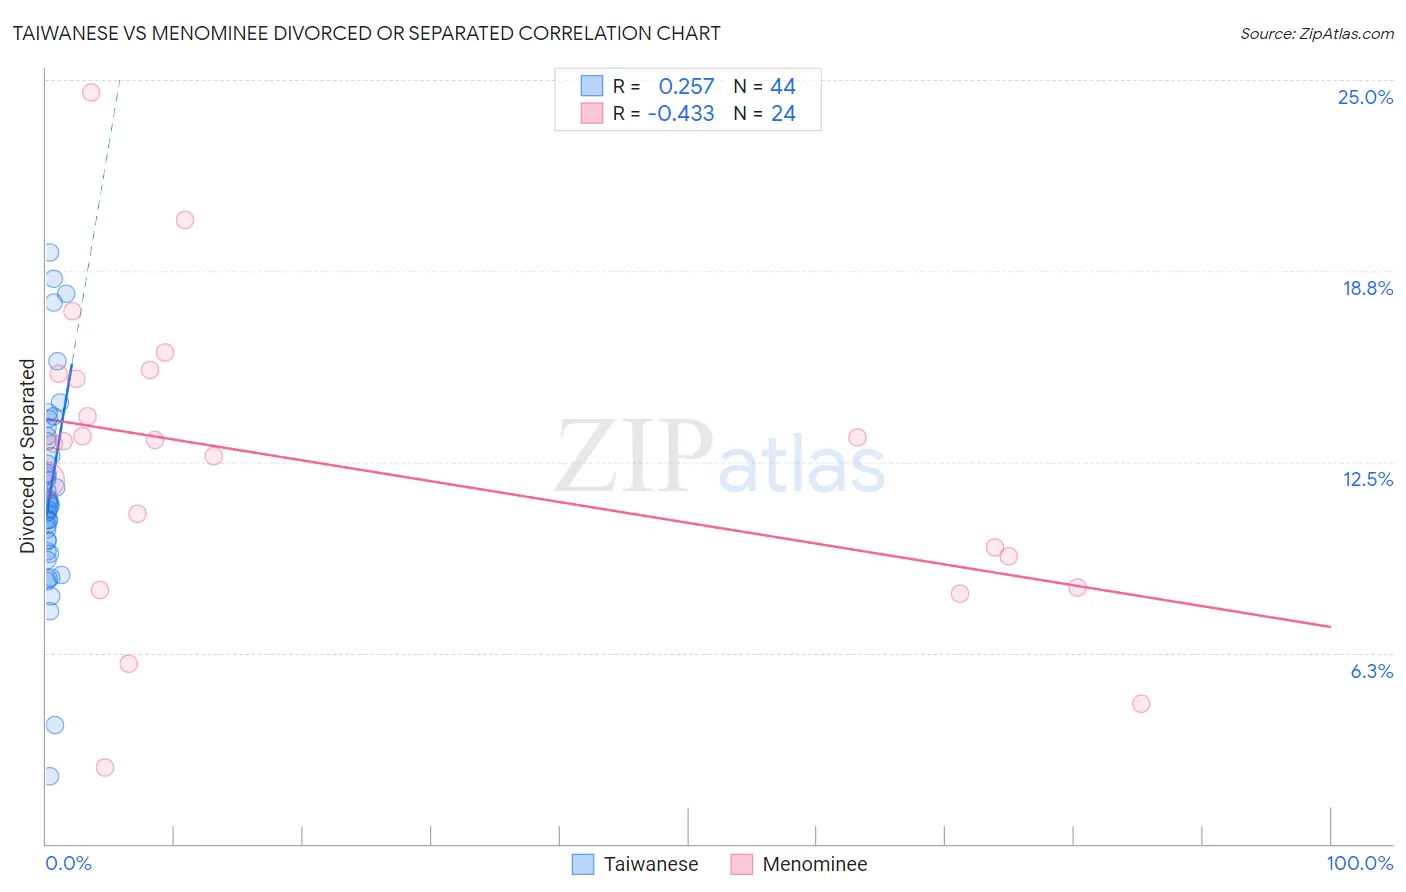
Taiwanese vs Menominee Divorced or Separated Correlation Chart
The statistical analysis conducted on geographies consisting of 31,709,765 people shows a weak positive correlation between the proportion of Taiwanese and percentage of population currently divorced or separated in the United States with a correlation coefficient (R) of 0.257 and weighted average of 11.5%. Similarly, the statistical analysis conducted on geographies consisting of 45,778,710 people shows a moderate negative correlation between the proportion of Menominee and percentage of population currently divorced or separated in the United States with a correlation coefficient (R) of -0.433 and weighted average of 11.8%, a difference of 2.6%.
Divorced or Separated Correlation Summary
| Measurement | Taiwanese | Menominee |
| Minimum | 2.2% | 2.5% |
| Maximum | 19.3% | 24.6% |
| Range | 17.1% | 22.1% |
| Mean | 11.5% | 12.4% |
| Median | 11.1% | 13.1% |
| Interquartile 25% (IQ1) | 9.7% | 8.9% |
| Interquartile 75% (IQ3) | 13.3% | 15.3% |
| Interquartile Range (IQR) | 3.5% | 6.4% |
| Standard Deviation (Sample) | 3.3% | 4.9% |
| Standard Deviation (Population) | 3.3% | 4.8% |
Similar Demographics by Divorced or Separated
Demographics Similar to Taiwanese by Divorced or Separated
In terms of divorced or separated, the demographic groups most similar to Taiwanese are Jordanian (11.5%, a difference of 0.060%), Immigrants from North Macedonia (11.5%, a difference of 0.060%), Immigrants from Northern Africa (11.5%, a difference of 0.080%), Albanian (11.5%, a difference of 0.10%), and Paraguayan (11.5%, a difference of 0.13%).
| Demographics | Rating | Rank | Divorced or Separated |
| Immigrants | Syria | 99.7 /100 | #67 | Exceptional 11.4% |
| Palestinians | 99.7 /100 | #68 | Exceptional 11.5% |
| Immigrants | Belgium | 99.7 /100 | #69 | Exceptional 11.5% |
| Immigrants | Eastern Europe | 99.7 /100 | #70 | Exceptional 11.5% |
| Paraguayans | 99.7 /100 | #71 | Exceptional 11.5% |
| Jordanians | 99.6 /100 | #72 | Exceptional 11.5% |
| Immigrants | North Macedonia | 99.6 /100 | #73 | Exceptional 11.5% |
| Taiwanese | 99.6 /100 | #74 | Exceptional 11.5% |
| Immigrants | Northern Africa | 99.6 /100 | #75 | Exceptional 11.5% |
| Albanians | 99.6 /100 | #76 | Exceptional 11.5% |
| Immigrants | Italy | 99.5 /100 | #77 | Exceptional 11.5% |
| Afghans | 99.4 /100 | #78 | Exceptional 11.5% |
| Guyanese | 99.4 /100 | #79 | Exceptional 11.5% |
| Immigrants | Switzerland | 99.4 /100 | #80 | Exceptional 11.5% |
| Russians | 99.4 /100 | #81 | Exceptional 11.5% |
Demographics Similar to Menominee by Divorced or Separated
In terms of divorced or separated, the demographic groups most similar to Menominee are Immigrants (11.8%, a difference of 0.020%), Ugandan (11.8%, a difference of 0.090%), Romanian (11.8%, a difference of 0.12%), Iraqi (11.8%, a difference of 0.13%), and Ukrainian (11.8%, a difference of 0.20%).
| Demographics | Rating | Rank | Divorced or Separated |
| Lithuanians | 95.7 /100 | #115 | Exceptional 11.7% |
| Immigrants | Iraq | 95.4 /100 | #116 | Exceptional 11.7% |
| Immigrants | Uganda | 95.3 /100 | #117 | Exceptional 11.7% |
| Ecuadorians | 95.3 /100 | #118 | Exceptional 11.7% |
| Syrians | 95.1 /100 | #119 | Exceptional 11.7% |
| Iraqis | 94.6 /100 | #120 | Exceptional 11.8% |
| Romanians | 94.5 /100 | #121 | Exceptional 11.8% |
| Menominee | 93.8 /100 | #122 | Exceptional 11.8% |
| Immigrants | Immigrants | 93.7 /100 | #123 | Exceptional 11.8% |
| Ugandans | 93.1 /100 | #124 | Exceptional 11.8% |
| Ukrainians | 92.3 /100 | #125 | Exceptional 11.8% |
| South American Indians | 92.1 /100 | #126 | Exceptional 11.8% |
| South Africans | 88.9 /100 | #127 | Excellent 11.8% |
| Immigrants | Ecuador | 88.9 /100 | #128 | Excellent 11.8% |
| Immigrants | St. Vincent and the Grenadines | 88.4 /100 | #129 | Excellent 11.8% |