Syrian vs Eastern European Divorced or Separated
COMPARE
Syrian
Eastern European
Divorced or Separated
Divorced or Separated Comparison
Syrians
Eastern Europeans
11.7%
DIVORCED OR SEPARATED
95.1/ 100
METRIC RATING
119th/ 347
METRIC RANK
11.3%
DIVORCED OR SEPARATED
99.9/ 100
METRIC RATING
54th/ 347
METRIC RANK
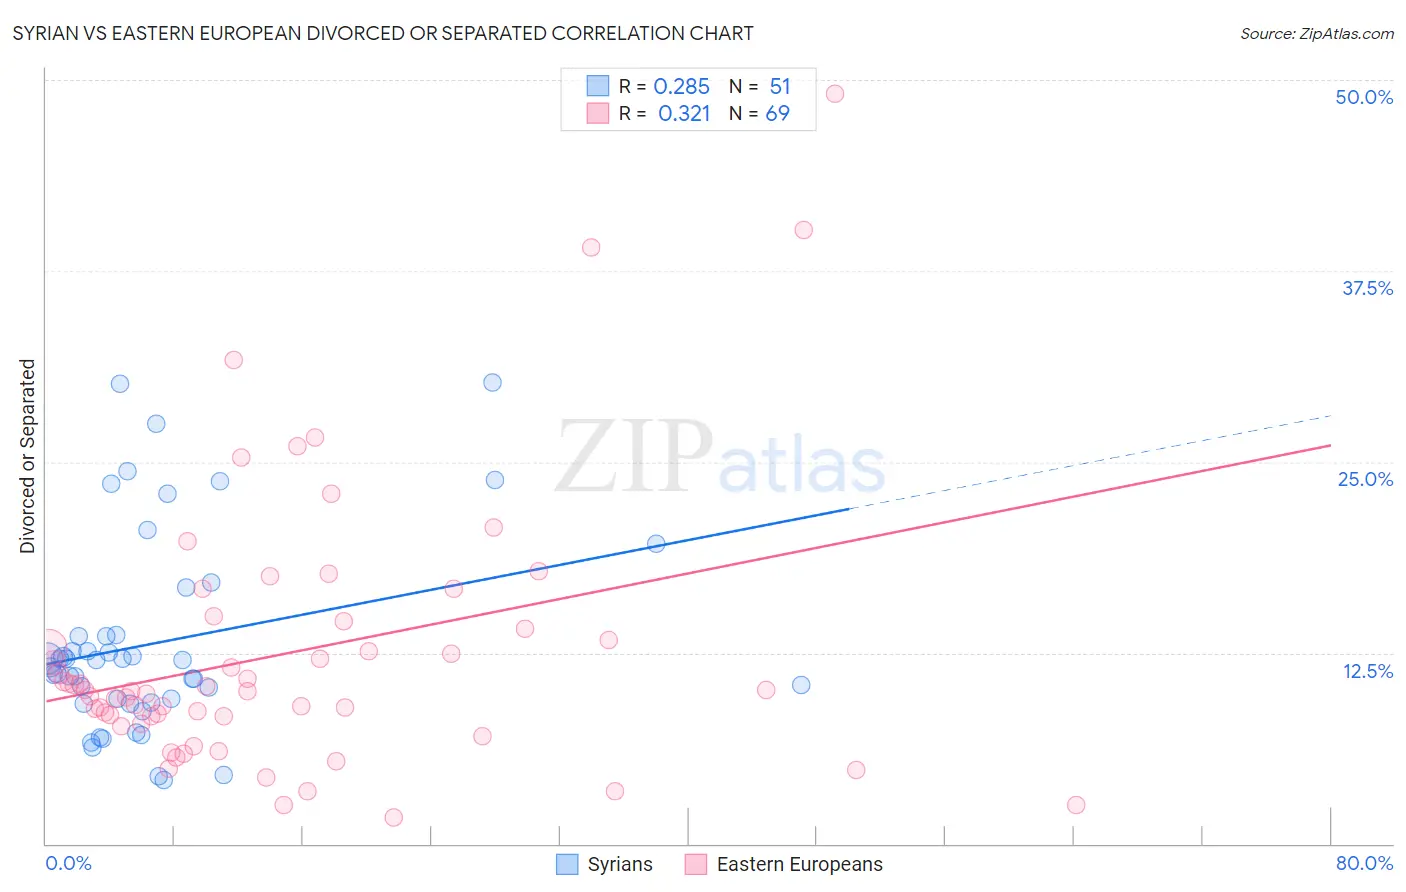
Syrian vs Eastern European Divorced or Separated Correlation Chart
The statistical analysis conducted on geographies consisting of 266,220,944 people shows a weak positive correlation between the proportion of Syrians and percentage of population currently divorced or separated in the United States with a correlation coefficient (R) of 0.285 and weighted average of 11.7%. Similarly, the statistical analysis conducted on geographies consisting of 461,055,019 people shows a mild positive correlation between the proportion of Eastern Europeans and percentage of population currently divorced or separated in the United States with a correlation coefficient (R) of 0.321 and weighted average of 11.3%, a difference of 3.9%.
Divorced or Separated Correlation Summary
| Measurement | Syrian | Eastern European |
| Minimum | 4.2% | 1.7% |
| Maximum | 30.2% | 49.1% |
| Range | 26.0% | 47.4% |
| Mean | 13.2% | 12.5% |
| Median | 12.0% | 10.0% |
| Interquartile 25% (IQ1) | 9.3% | 8.1% |
| Interquartile 75% (IQ3) | 13.6% | 14.3% |
| Interquartile Range (IQR) | 4.4% | 6.3% |
| Standard Deviation (Sample) | 6.5% | 8.9% |
| Standard Deviation (Population) | 6.4% | 8.8% |
Similar Demographics by Divorced or Separated
Demographics Similar to Syrians by Divorced or Separated
In terms of divorced or separated, the demographic groups most similar to Syrians are Ecuadorian (11.7%, a difference of 0.040%), Immigrants from Uganda (11.7%, a difference of 0.050%), Immigrants from Iraq (11.7%, a difference of 0.060%), Iraqi (11.8%, a difference of 0.090%), and Romanian (11.8%, a difference of 0.10%).
| Demographics | Rating | Rank | Divorced or Separated |
| Immigrants | France | 96.6 /100 | #112 | Exceptional 11.7% |
| Estonians | 96.6 /100 | #113 | Exceptional 11.7% |
| Immigrants | Norway | 95.9 /100 | #114 | Exceptional 11.7% |
| Lithuanians | 95.7 /100 | #115 | Exceptional 11.7% |
| Immigrants | Iraq | 95.4 /100 | #116 | Exceptional 11.7% |
| Immigrants | Uganda | 95.3 /100 | #117 | Exceptional 11.7% |
| Ecuadorians | 95.3 /100 | #118 | Exceptional 11.7% |
| Syrians | 95.1 /100 | #119 | Exceptional 11.7% |
| Iraqis | 94.6 /100 | #120 | Exceptional 11.8% |
| Romanians | 94.5 /100 | #121 | Exceptional 11.8% |
| Menominee | 93.8 /100 | #122 | Exceptional 11.8% |
| Immigrants | Immigrants | 93.7 /100 | #123 | Exceptional 11.8% |
| Ugandans | 93.1 /100 | #124 | Exceptional 11.8% |
| Ukrainians | 92.3 /100 | #125 | Exceptional 11.8% |
| South American Indians | 92.1 /100 | #126 | Exceptional 11.8% |
Demographics Similar to Eastern Europeans by Divorced or Separated
In terms of divorced or separated, the demographic groups most similar to Eastern Europeans are Immigrants from Yemen (11.3%, a difference of 0.010%), Immigrants from Philippines (11.3%, a difference of 0.070%), Immigrants from Vietnam (11.3%, a difference of 0.080%), Immigrants from Lithuania (11.3%, a difference of 0.11%), and Sri Lankan (11.3%, a difference of 0.14%).
| Demographics | Rating | Rank | Divorced or Separated |
| Immigrants | Poland | 100.0 /100 | #47 | Exceptional 11.2% |
| Immigrants | Turkey | 100.0 /100 | #48 | Exceptional 11.2% |
| Immigrants | Saudi Arabia | 100.0 /100 | #49 | Exceptional 11.2% |
| Bolivians | 100.0 /100 | #50 | Exceptional 11.2% |
| Immigrants | Bolivia | 100.0 /100 | #51 | Exceptional 11.3% |
| Immigrants | Australia | 99.9 /100 | #52 | Exceptional 11.3% |
| Immigrants | Lithuania | 99.9 /100 | #53 | Exceptional 11.3% |
| Eastern Europeans | 99.9 /100 | #54 | Exceptional 11.3% |
| Immigrants | Yemen | 99.9 /100 | #55 | Exceptional 11.3% |
| Immigrants | Philippines | 99.9 /100 | #56 | Exceptional 11.3% |
| Immigrants | Vietnam | 99.9 /100 | #57 | Exceptional 11.3% |
| Sri Lankans | 99.9 /100 | #58 | Exceptional 11.3% |
| Israelis | 99.9 /100 | #59 | Exceptional 11.3% |
| Immigrants | Russia | 99.9 /100 | #60 | Exceptional 11.3% |
| Koreans | 99.9 /100 | #61 | Exceptional 11.3% |