Swiss vs Immigrants from Chile 9th Grade
COMPARE
Swiss
Immigrants from Chile
9th Grade
9th Grade Comparison
Swiss
Immigrants from Chile
95.7%
9TH GRADE
99.2/ 100
METRIC RATING
83rd/ 347
METRIC RANK
94.5%
9TH GRADE
13.4/ 100
METRIC RATING
210th/ 347
METRIC RANK
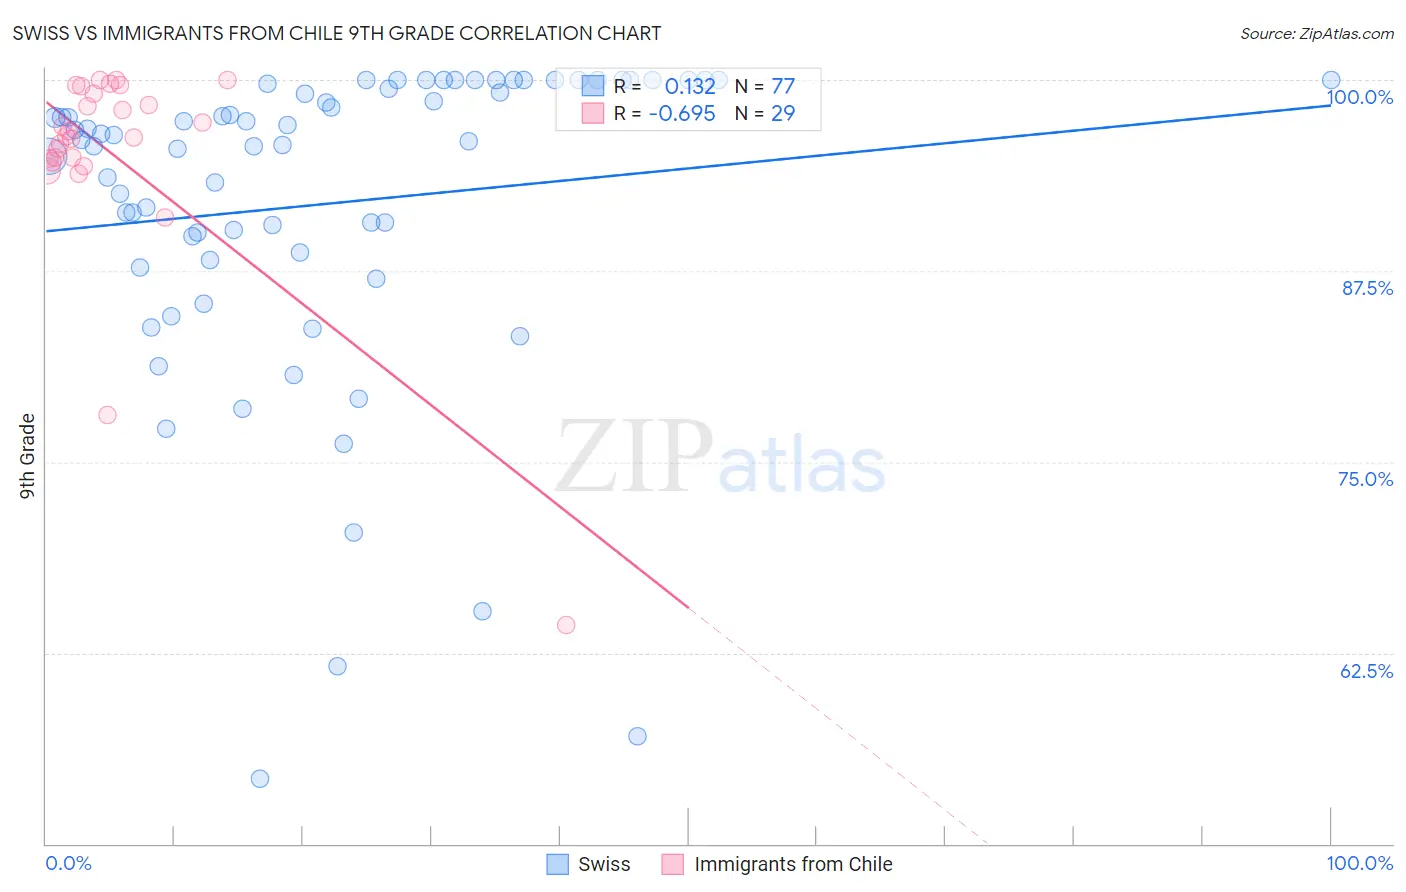
Swiss vs Immigrants from Chile 9th Grade Correlation Chart
The statistical analysis conducted on geographies consisting of 465,022,424 people shows a poor positive correlation between the proportion of Swiss and percentage of population with at least 9th grade education in the United States with a correlation coefficient (R) of 0.132 and weighted average of 95.7%. Similarly, the statistical analysis conducted on geographies consisting of 218,647,266 people shows a significant negative correlation between the proportion of Immigrants from Chile and percentage of population with at least 9th grade education in the United States with a correlation coefficient (R) of -0.695 and weighted average of 94.5%, a difference of 1.2%.
9th Grade Correlation Summary
| Measurement | Swiss | Immigrants from Chile |
| Minimum | 54.2% | 64.3% |
| Maximum | 100.0% | 100.0% |
| Range | 45.8% | 35.7% |
| Mean | 91.9% | 95.1% |
| Median | 96.1% | 96.3% |
| Interquartile 25% (IQ1) | 88.4% | 94.8% |
| Interquartile 75% (IQ3) | 99.9% | 99.4% |
| Interquartile Range (IQR) | 11.4% | 4.6% |
| Standard Deviation (Sample) | 10.4% | 7.3% |
| Standard Deviation (Population) | 10.3% | 7.1% |
Similar Demographics by 9th Grade
Demographics Similar to Swiss by 9th Grade
In terms of 9th grade, the demographic groups most similar to Swiss are Immigrants from Denmark (95.7%, a difference of 0.010%), Icelander (95.7%, a difference of 0.010%), Immigrants from Western Europe (95.7%, a difference of 0.010%), Bhutanese (95.7%, a difference of 0.020%), and Arapaho (95.7%, a difference of 0.020%).
| Demographics | Rating | Rank | 9th Grade |
| Immigrants | Sweden | 99.5 /100 | #76 | Exceptional 95.8% |
| Whites/Caucasians | 99.4 /100 | #77 | Exceptional 95.8% |
| Immigrants | South Africa | 99.4 /100 | #78 | Exceptional 95.8% |
| Romanians | 99.3 /100 | #79 | Exceptional 95.7% |
| Bhutanese | 99.3 /100 | #80 | Exceptional 95.7% |
| Arapaho | 99.3 /100 | #81 | Exceptional 95.7% |
| Puget Sound Salish | 99.2 /100 | #82 | Exceptional 95.7% |
| Swiss | 99.2 /100 | #83 | Exceptional 95.7% |
| Immigrants | Denmark | 99.1 /100 | #84 | Exceptional 95.7% |
| Icelanders | 99.1 /100 | #85 | Exceptional 95.7% |
| Immigrants | Western Europe | 99.1 /100 | #86 | Exceptional 95.7% |
| Okinawans | 99.0 /100 | #87 | Exceptional 95.7% |
| Immigrants | Czechoslovakia | 98.9 /100 | #88 | Exceptional 95.7% |
| Yugoslavians | 98.9 /100 | #89 | Exceptional 95.7% |
| South Africans | 98.8 /100 | #90 | Exceptional 95.6% |
Demographics Similar to Immigrants from Chile by 9th Grade
In terms of 9th grade, the demographic groups most similar to Immigrants from Chile are Comanche (94.6%, a difference of 0.020%), Immigrants from Indonesia (94.5%, a difference of 0.020%), Immigrants from Malaysia (94.5%, a difference of 0.020%), Immigrants from Oceania (94.5%, a difference of 0.020%), and Immigrants from Pakistan (94.6%, a difference of 0.030%).
| Demographics | Rating | Rank | 9th Grade |
| Immigrants | Bahamas | 19.8 /100 | #203 | Poor 94.6% |
| Moroccans | 19.6 /100 | #204 | Poor 94.6% |
| Immigrants | Sudan | 17.6 /100 | #205 | Poor 94.6% |
| Samoans | 17.3 /100 | #206 | Poor 94.6% |
| Immigrants | Morocco | 16.3 /100 | #207 | Poor 94.6% |
| Immigrants | Pakistan | 15.5 /100 | #208 | Poor 94.6% |
| Comanche | 14.9 /100 | #209 | Poor 94.6% |
| Immigrants | Chile | 13.4 /100 | #210 | Poor 94.5% |
| Immigrants | Indonesia | 12.3 /100 | #211 | Poor 94.5% |
| Immigrants | Malaysia | 12.2 /100 | #212 | Poor 94.5% |
| Immigrants | Oceania | 12.1 /100 | #213 | Poor 94.5% |
| Immigrants | Liberia | 11.8 /100 | #214 | Poor 94.5% |
| Immigrants | Syria | 11.0 /100 | #215 | Poor 94.5% |
| Immigrants | Western Asia | 10.7 /100 | #216 | Poor 94.5% |
| Asians | 9.9 /100 | #217 | Tragic 94.5% |