Swedish vs Somali Single Father Households
COMPARE
Swedish
Somali
Single Father Households
Single Father Households Comparison
Swedes
Somalis
2.3%
SINGLE FATHER HOUSEHOLDS
61.6/ 100
METRIC RATING
171st/ 347
METRIC RANK
2.5%
SINGLE FATHER HOUSEHOLDS
2.1/ 100
METRIC RATING
250th/ 347
METRIC RANK
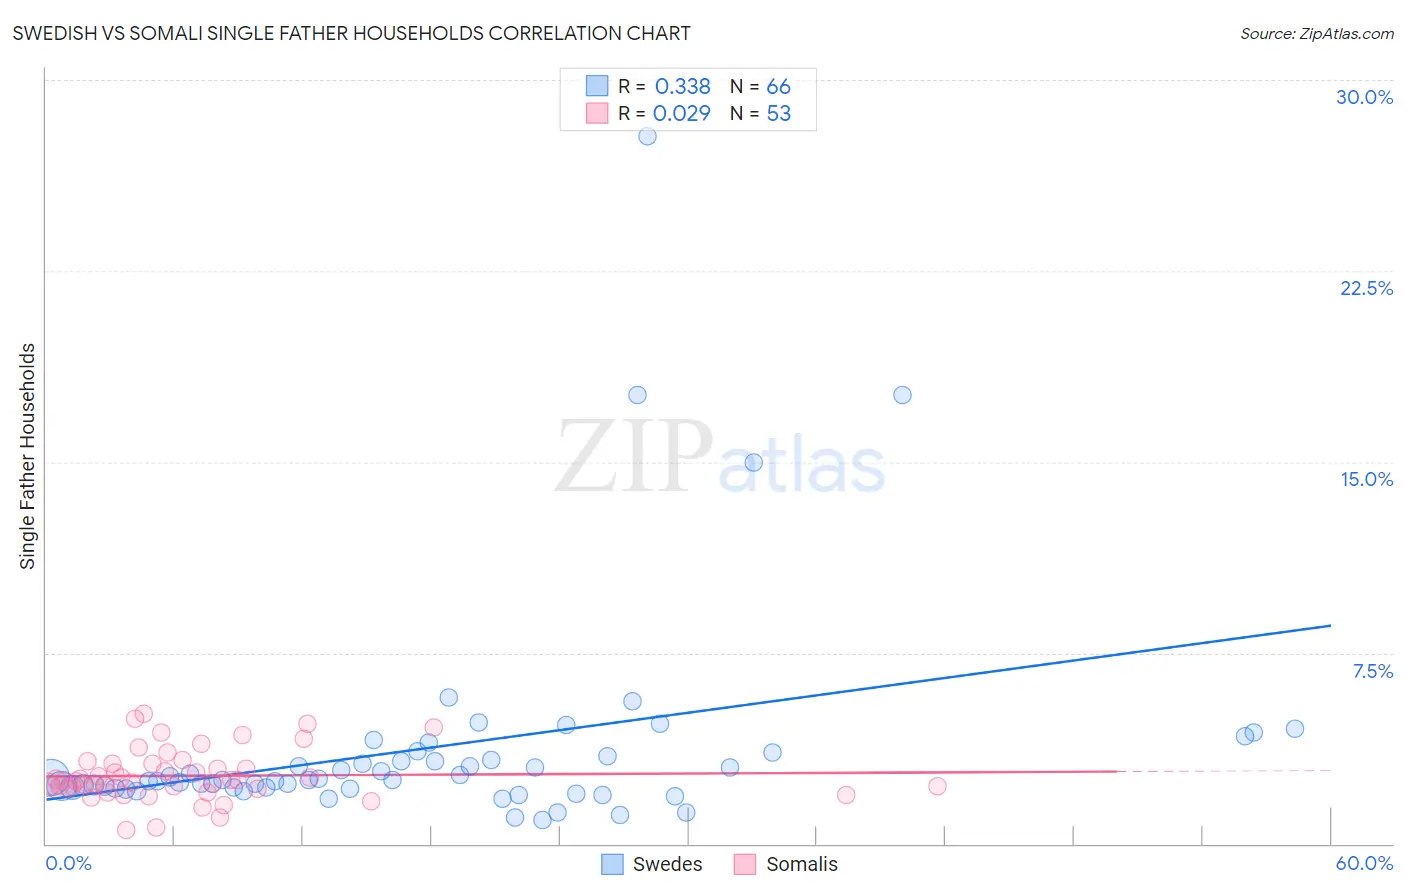
Swedish vs Somali Single Father Households Correlation Chart
The statistical analysis conducted on geographies consisting of 527,613,480 people shows a mild positive correlation between the proportion of Swedes and percentage of single father households in the United States with a correlation coefficient (R) of 0.338 and weighted average of 2.3%. Similarly, the statistical analysis conducted on geographies consisting of 99,117,058 people shows no correlation between the proportion of Somalis and percentage of single father households in the United States with a correlation coefficient (R) of 0.029 and weighted average of 2.5%, a difference of 8.0%.
Single Father Households Correlation Summary
| Measurement | Swedish | Somali |
| Minimum | 0.93% | 0.55% |
| Maximum | 27.8% | 5.1% |
| Range | 26.8% | 4.5% |
| Mean | 3.8% | 2.7% |
| Median | 2.5% | 2.5% |
| Interquartile 25% (IQ1) | 2.2% | 2.2% |
| Interquartile 75% (IQ3) | 3.5% | 3.1% |
| Interquartile Range (IQR) | 1.3% | 0.97% |
| Standard Deviation (Sample) | 4.3% | 1.0% |
| Standard Deviation (Population) | 4.3% | 0.99% |
Similar Demographics by Single Father Households
Demographics Similar to Swedes by Single Father Households
In terms of single father households, the demographic groups most similar to Swedes are Ugandan (2.3%, a difference of 0.050%), Czech (2.3%, a difference of 0.070%), Icelander (2.3%, a difference of 0.12%), South American (2.3%, a difference of 0.21%), and Czechoslovakian (2.3%, a difference of 0.21%).
| Demographics | Rating | Rank | Single Father Households |
| Pakistanis | 70.6 /100 | #164 | Good 2.3% |
| Scotch-Irish | 69.4 /100 | #165 | Good 2.3% |
| English | 68.6 /100 | #166 | Good 2.3% |
| South Americans | 64.3 /100 | #167 | Good 2.3% |
| Icelanders | 63.1 /100 | #168 | Good 2.3% |
| Czechs | 62.5 /100 | #169 | Good 2.3% |
| Ugandans | 62.2 /100 | #170 | Good 2.3% |
| Swedes | 61.6 /100 | #171 | Good 2.3% |
| Czechoslovakians | 58.9 /100 | #172 | Average 2.3% |
| Celtics | 55.4 /100 | #173 | Average 2.3% |
| Afghans | 50.0 /100 | #174 | Average 2.3% |
| Immigrants | Jamaica | 49.1 /100 | #175 | Average 2.3% |
| Danes | 48.2 /100 | #176 | Average 2.3% |
| Colombians | 48.0 /100 | #177 | Average 2.3% |
| Costa Ricans | 44.1 /100 | #178 | Average 2.3% |
Demographics Similar to Somalis by Single Father Households
In terms of single father households, the demographic groups most similar to Somalis are Liberian (2.5%, a difference of 0.090%), Immigrants from Eritrea (2.5%, a difference of 0.11%), Immigrants from Cameroon (2.5%, a difference of 0.17%), Immigrants from Somalia (2.5%, a difference of 0.18%), and Immigrants from Thailand (2.5%, a difference of 0.22%).
| Demographics | Rating | Rank | Single Father Households |
| Spaniards | 3.1 /100 | #243 | Tragic 2.5% |
| Immigrants | Middle Africa | 2.8 /100 | #244 | Tragic 2.5% |
| Basques | 2.5 /100 | #245 | Tragic 2.5% |
| Native Hawaiians | 2.5 /100 | #246 | Tragic 2.5% |
| Delaware | 2.5 /100 | #247 | Tragic 2.5% |
| Bahamians | 2.4 /100 | #248 | Tragic 2.5% |
| Immigrants | Cameroon | 2.3 /100 | #249 | Tragic 2.5% |
| Somalis | 2.1 /100 | #250 | Tragic 2.5% |
| Liberians | 2.0 /100 | #251 | Tragic 2.5% |
| Immigrants | Eritrea | 2.0 /100 | #252 | Tragic 2.5% |
| Immigrants | Somalia | 1.9 /100 | #253 | Tragic 2.5% |
| Immigrants | Thailand | 1.8 /100 | #254 | Tragic 2.5% |
| Tongans | 1.5 /100 | #255 | Tragic 2.5% |
| Potawatomi | 1.4 /100 | #256 | Tragic 2.5% |
| Immigrants | Congo | 1.2 /100 | #257 | Tragic 2.5% |