Immigrants from Somalia vs Somali Single Father Households
COMPARE
Immigrants from Somalia
Somali
Single Father Households
Single Father Households Comparison
Immigrants from Somalia
Somalis
2.5%
SINGLE FATHER HOUSEHOLDS
1.9/ 100
METRIC RATING
253rd/ 347
METRIC RANK
2.5%
SINGLE FATHER HOUSEHOLDS
2.1/ 100
METRIC RATING
250th/ 347
METRIC RANK
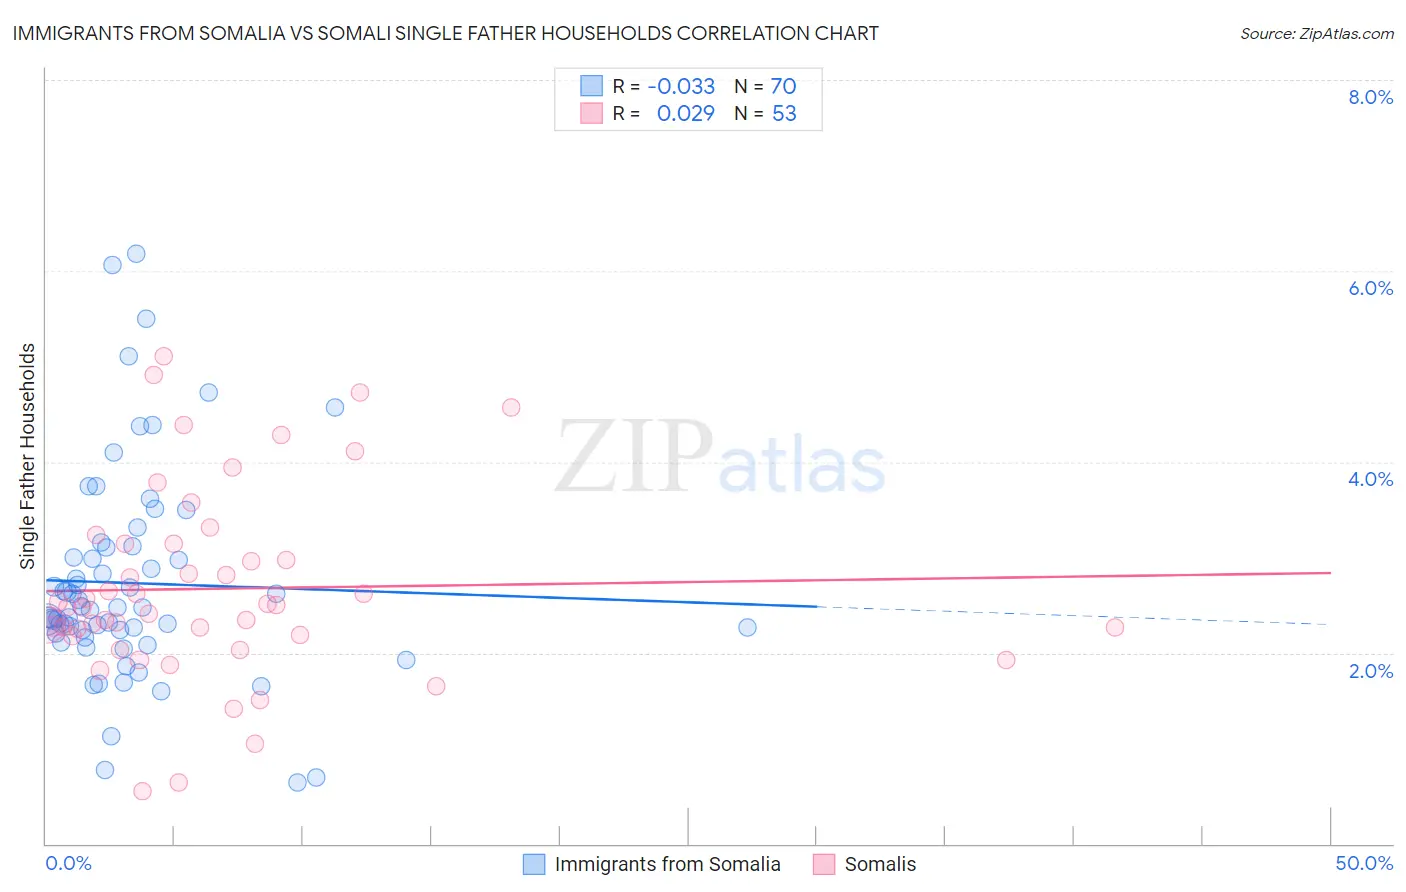
Immigrants from Somalia vs Somali Single Father Households Correlation Chart
The statistical analysis conducted on geographies consisting of 91,982,855 people shows no correlation between the proportion of Immigrants from Somalia and percentage of single father households in the United States with a correlation coefficient (R) of -0.033 and weighted average of 2.5%. Similarly, the statistical analysis conducted on geographies consisting of 99,117,058 people shows no correlation between the proportion of Somalis and percentage of single father households in the United States with a correlation coefficient (R) of 0.029 and weighted average of 2.5%, a difference of 0.18%.
Single Father Households Correlation Summary
| Measurement | Immigrants from Somalia | Somali |
| Minimum | 0.64% | 0.55% |
| Maximum | 6.2% | 5.1% |
| Range | 5.5% | 4.5% |
| Mean | 2.7% | 2.7% |
| Median | 2.5% | 2.5% |
| Interquartile 25% (IQ1) | 2.2% | 2.2% |
| Interquartile 75% (IQ3) | 3.1% | 3.1% |
| Interquartile Range (IQR) | 0.90% | 0.97% |
| Standard Deviation (Sample) | 1.1% | 1.0% |
| Standard Deviation (Population) | 1.1% | 0.99% |
Demographics Similar to Immigrants from Somalia and Somalis by Single Father Households
In terms of single father households, the demographic groups most similar to Immigrants from Somalia are Immigrants from Thailand (2.5%, a difference of 0.040%), Immigrants from Eritrea (2.5%, a difference of 0.070%), Liberian (2.5%, a difference of 0.090%), Immigrants from Cameroon (2.5%, a difference of 0.35%), and Bahamian (2.5%, a difference of 0.44%). Similarly, the demographic groups most similar to Somalis are Liberian (2.5%, a difference of 0.090%), Immigrants from Eritrea (2.5%, a difference of 0.11%), Immigrants from Cameroon (2.5%, a difference of 0.17%), Immigrants from Thailand (2.5%, a difference of 0.22%), and Bahamian (2.5%, a difference of 0.25%).
| Demographics | Rating | Rank | Single Father Households |
| Portuguese | 4.1 /100 | #241 | Tragic 2.5% |
| Osage | 4.1 /100 | #242 | Tragic 2.5% |
| Spaniards | 3.1 /100 | #243 | Tragic 2.5% |
| Immigrants | Middle Africa | 2.8 /100 | #244 | Tragic 2.5% |
| Basques | 2.5 /100 | #245 | Tragic 2.5% |
| Native Hawaiians | 2.5 /100 | #246 | Tragic 2.5% |
| Delaware | 2.5 /100 | #247 | Tragic 2.5% |
| Bahamians | 2.4 /100 | #248 | Tragic 2.5% |
| Immigrants | Cameroon | 2.3 /100 | #249 | Tragic 2.5% |
| Somalis | 2.1 /100 | #250 | Tragic 2.5% |
| Liberians | 2.0 /100 | #251 | Tragic 2.5% |
| Immigrants | Eritrea | 2.0 /100 | #252 | Tragic 2.5% |
| Immigrants | Somalia | 1.9 /100 | #253 | Tragic 2.5% |
| Immigrants | Thailand | 1.8 /100 | #254 | Tragic 2.5% |
| Tongans | 1.5 /100 | #255 | Tragic 2.5% |
| Potawatomi | 1.4 /100 | #256 | Tragic 2.5% |
| Immigrants | Congo | 1.2 /100 | #257 | Tragic 2.5% |
| Spanish | 1.1 /100 | #258 | Tragic 2.5% |
| Comanche | 1.0 /100 | #259 | Tragic 2.5% |
| Immigrants | Caribbean | 1.0 /100 | #260 | Tragic 2.5% |
| Immigrants | Belize | 0.9 /100 | #261 | Tragic 2.5% |