Immigrants from Cameroon vs Somali Single Father Households
COMPARE
Immigrants from Cameroon
Somali
Single Father Households
Single Father Households Comparison
Immigrants from Cameroon
Somalis
2.5%
SINGLE FATHER HOUSEHOLDS
2.3/ 100
METRIC RATING
249th/ 347
METRIC RANK
2.5%
SINGLE FATHER HOUSEHOLDS
2.1/ 100
METRIC RATING
250th/ 347
METRIC RANK
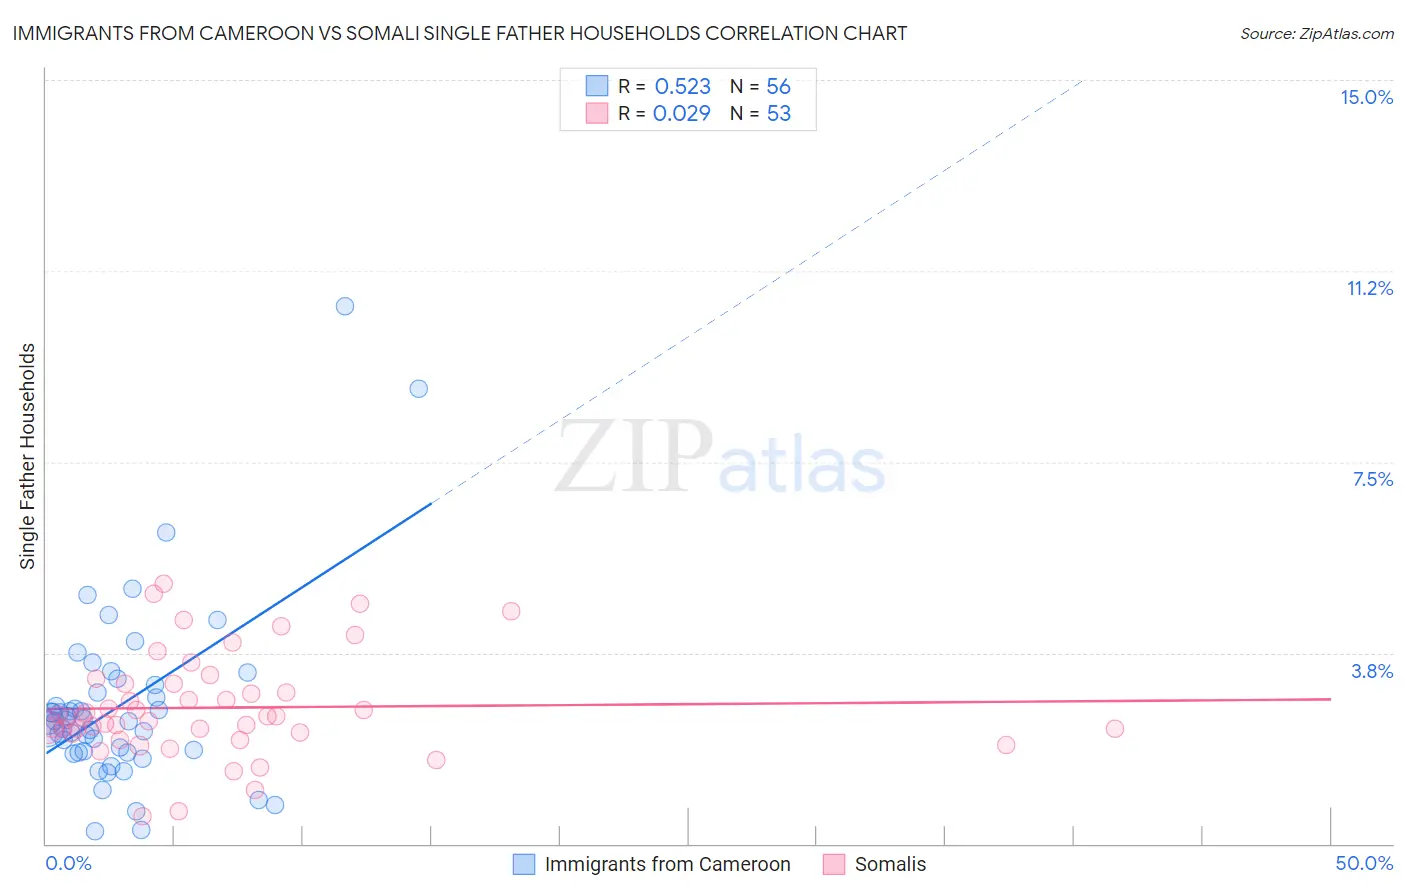
Immigrants from Cameroon vs Somali Single Father Households Correlation Chart
The statistical analysis conducted on geographies consisting of 130,430,432 people shows a substantial positive correlation between the proportion of Immigrants from Cameroon and percentage of single father households in the United States with a correlation coefficient (R) of 0.523 and weighted average of 2.5%. Similarly, the statistical analysis conducted on geographies consisting of 99,117,058 people shows no correlation between the proportion of Somalis and percentage of single father households in the United States with a correlation coefficient (R) of 0.029 and weighted average of 2.5%, a difference of 0.17%.
Single Father Households Correlation Summary
| Measurement | Immigrants from Cameroon | Somali |
| Minimum | 0.24% | 0.55% |
| Maximum | 10.6% | 5.1% |
| Range | 10.3% | 4.5% |
| Mean | 2.7% | 2.7% |
| Median | 2.4% | 2.5% |
| Interquartile 25% (IQ1) | 1.8% | 2.2% |
| Interquartile 75% (IQ3) | 3.0% | 3.1% |
| Interquartile Range (IQR) | 1.2% | 0.97% |
| Standard Deviation (Sample) | 1.8% | 1.0% |
| Standard Deviation (Population) | 1.8% | 0.99% |
Demographics Similar to Immigrants from Cameroon and Somalis by Single Father Households
In terms of single father households, the demographic groups most similar to Immigrants from Cameroon are Bahamian (2.5%, a difference of 0.090%), Delaware (2.5%, a difference of 0.13%), Native Hawaiian (2.5%, a difference of 0.14%), Basque (2.5%, a difference of 0.16%), and Liberian (2.5%, a difference of 0.26%). Similarly, the demographic groups most similar to Somalis are Liberian (2.5%, a difference of 0.090%), Immigrants from Eritrea (2.5%, a difference of 0.11%), Immigrants from Somalia (2.5%, a difference of 0.18%), Immigrants from Thailand (2.5%, a difference of 0.22%), and Bahamian (2.5%, a difference of 0.25%).
| Demographics | Rating | Rank | Single Father Households |
| Immigrants | Oceania | 5.8 /100 | #239 | Tragic 2.5% |
| Immigrants | Dominica | 4.8 /100 | #240 | Tragic 2.5% |
| Portuguese | 4.1 /100 | #241 | Tragic 2.5% |
| Osage | 4.1 /100 | #242 | Tragic 2.5% |
| Spaniards | 3.1 /100 | #243 | Tragic 2.5% |
| Immigrants | Middle Africa | 2.8 /100 | #244 | Tragic 2.5% |
| Basques | 2.5 /100 | #245 | Tragic 2.5% |
| Native Hawaiians | 2.5 /100 | #246 | Tragic 2.5% |
| Delaware | 2.5 /100 | #247 | Tragic 2.5% |
| Bahamians | 2.4 /100 | #248 | Tragic 2.5% |
| Immigrants | Cameroon | 2.3 /100 | #249 | Tragic 2.5% |
| Somalis | 2.1 /100 | #250 | Tragic 2.5% |
| Liberians | 2.0 /100 | #251 | Tragic 2.5% |
| Immigrants | Eritrea | 2.0 /100 | #252 | Tragic 2.5% |
| Immigrants | Somalia | 1.9 /100 | #253 | Tragic 2.5% |
| Immigrants | Thailand | 1.8 /100 | #254 | Tragic 2.5% |
| Tongans | 1.5 /100 | #255 | Tragic 2.5% |
| Potawatomi | 1.4 /100 | #256 | Tragic 2.5% |
| Immigrants | Congo | 1.2 /100 | #257 | Tragic 2.5% |
| Spanish | 1.1 /100 | #258 | Tragic 2.5% |
| Comanche | 1.0 /100 | #259 | Tragic 2.5% |