Swedish vs Immigrants from Cuba Single Father Households
COMPARE
Swedish
Immigrants from Cuba
Single Father Households
Single Father Households Comparison
Swedes
Immigrants from Cuba
2.3%
SINGLE FATHER HOUSEHOLDS
61.6/ 100
METRIC RATING
171st/ 347
METRIC RANK
2.7%
SINGLE FATHER HOUSEHOLDS
0.1/ 100
METRIC RATING
286th/ 347
METRIC RANK
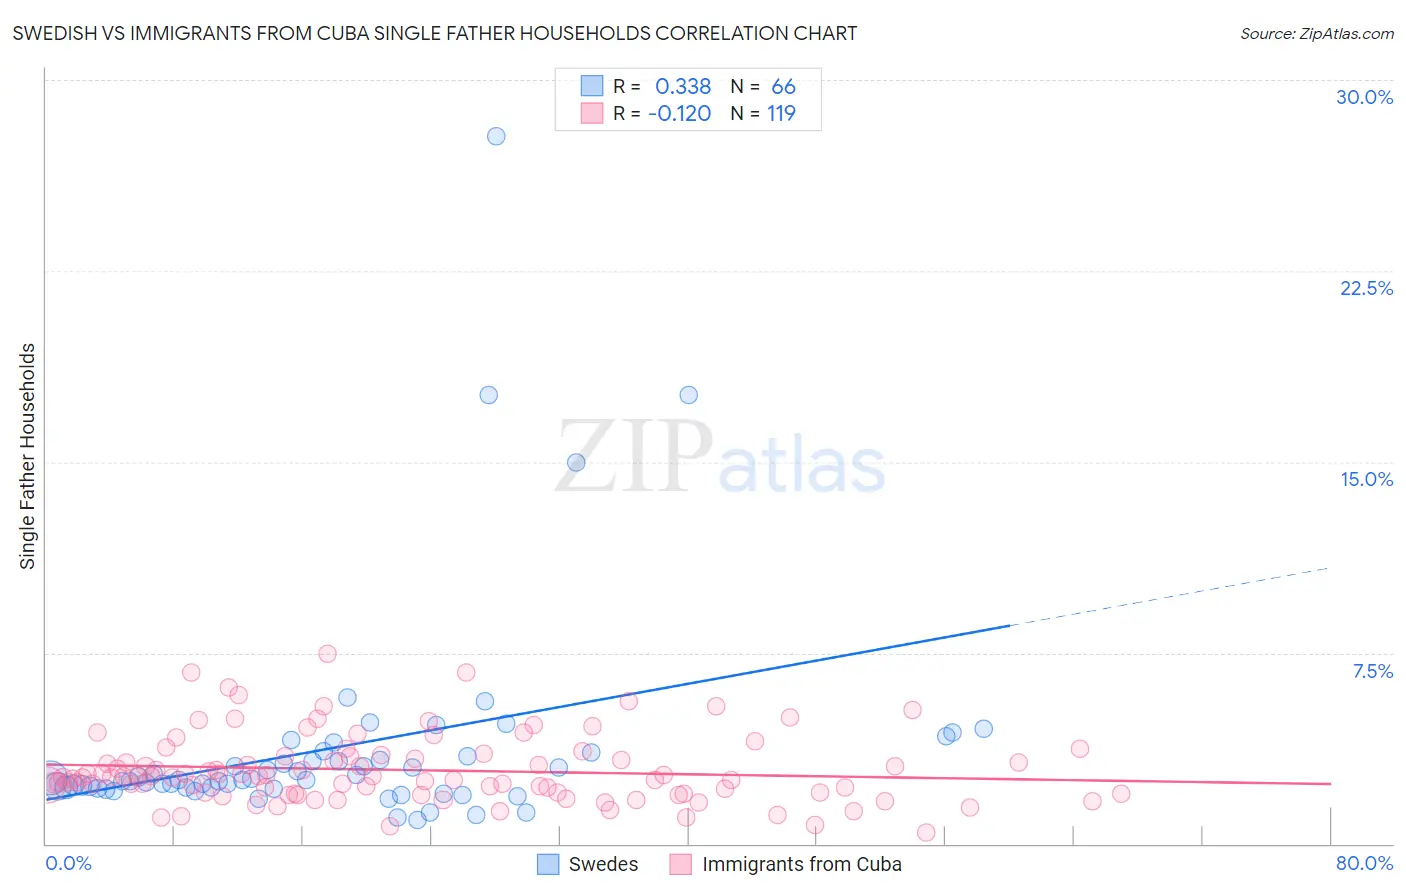
Swedish vs Immigrants from Cuba Single Father Households Correlation Chart
The statistical analysis conducted on geographies consisting of 527,613,480 people shows a mild positive correlation between the proportion of Swedes and percentage of single father households in the United States with a correlation coefficient (R) of 0.338 and weighted average of 2.3%. Similarly, the statistical analysis conducted on geographies consisting of 323,764,180 people shows a poor negative correlation between the proportion of Immigrants from Cuba and percentage of single father households in the United States with a correlation coefficient (R) of -0.120 and weighted average of 2.7%, a difference of 14.9%.
Single Father Households Correlation Summary
| Measurement | Swedish | Immigrants from Cuba |
| Minimum | 0.93% | 0.43% |
| Maximum | 27.8% | 7.5% |
| Range | 26.8% | 7.0% |
| Mean | 3.8% | 2.9% |
| Median | 2.5% | 2.6% |
| Interquartile 25% (IQ1) | 2.2% | 2.0% |
| Interquartile 75% (IQ3) | 3.5% | 3.4% |
| Interquartile Range (IQR) | 1.3% | 1.5% |
| Standard Deviation (Sample) | 4.3% | 1.3% |
| Standard Deviation (Population) | 4.3% | 1.3% |
Similar Demographics by Single Father Households
Demographics Similar to Swedes by Single Father Households
In terms of single father households, the demographic groups most similar to Swedes are Ugandan (2.3%, a difference of 0.050%), Czech (2.3%, a difference of 0.070%), Icelander (2.3%, a difference of 0.12%), South American (2.3%, a difference of 0.21%), and Czechoslovakian (2.3%, a difference of 0.21%).
| Demographics | Rating | Rank | Single Father Households |
| Pakistanis | 70.6 /100 | #164 | Good 2.3% |
| Scotch-Irish | 69.4 /100 | #165 | Good 2.3% |
| English | 68.6 /100 | #166 | Good 2.3% |
| South Americans | 64.3 /100 | #167 | Good 2.3% |
| Icelanders | 63.1 /100 | #168 | Good 2.3% |
| Czechs | 62.5 /100 | #169 | Good 2.3% |
| Ugandans | 62.2 /100 | #170 | Good 2.3% |
| Swedes | 61.6 /100 | #171 | Good 2.3% |
| Czechoslovakians | 58.9 /100 | #172 | Average 2.3% |
| Celtics | 55.4 /100 | #173 | Average 2.3% |
| Afghans | 50.0 /100 | #174 | Average 2.3% |
| Immigrants | Jamaica | 49.1 /100 | #175 | Average 2.3% |
| Danes | 48.2 /100 | #176 | Average 2.3% |
| Colombians | 48.0 /100 | #177 | Average 2.3% |
| Costa Ricans | 44.1 /100 | #178 | Average 2.3% |
Demographics Similar to Immigrants from Cuba by Single Father Households
In terms of single father households, the demographic groups most similar to Immigrants from Cuba are Ottawa (2.7%, a difference of 0.010%), Hawaiian (2.7%, a difference of 0.10%), Immigrants from Nicaragua (2.7%, a difference of 0.15%), Central American Indian (2.7%, a difference of 0.16%), and Immigrants from Cambodia (2.7%, a difference of 0.40%).
| Demographics | Rating | Rank | Single Father Households |
| Samoans | 0.1 /100 | #279 | Tragic 2.6% |
| Immigrants | Portugal | 0.1 /100 | #280 | Tragic 2.6% |
| Nicaraguans | 0.1 /100 | #281 | Tragic 2.6% |
| Dutch West Indians | 0.1 /100 | #282 | Tragic 2.6% |
| Immigrants | Nicaragua | 0.1 /100 | #283 | Tragic 2.7% |
| Hawaiians | 0.1 /100 | #284 | Tragic 2.7% |
| Ottawa | 0.1 /100 | #285 | Tragic 2.7% |
| Immigrants | Cuba | 0.1 /100 | #286 | Tragic 2.7% |
| Central American Indians | 0.0 /100 | #287 | Tragic 2.7% |
| Immigrants | Cambodia | 0.0 /100 | #288 | Tragic 2.7% |
| Tlingit-Haida | 0.0 /100 | #289 | Tragic 2.7% |
| Puget Sound Salish | 0.0 /100 | #290 | Tragic 2.7% |
| Blackfeet | 0.0 /100 | #291 | Tragic 2.7% |
| Choctaw | 0.0 /100 | #292 | Tragic 2.7% |
| Immigrants | Fiji | 0.0 /100 | #293 | Tragic 2.7% |