Swedish vs Immigrants from South Central Asia Family Households
COMPARE
Swedish
Immigrants from South Central Asia
Family Households
Family Households Comparison
Swedes
Immigrants from South Central Asia
64.5%
FAMILY HOUSEHOLDS
69.8/ 100
METRIC RATING
153rd/ 347
METRIC RANK
66.4%
FAMILY HOUSEHOLDS
100.0/ 100
METRIC RATING
49th/ 347
METRIC RANK
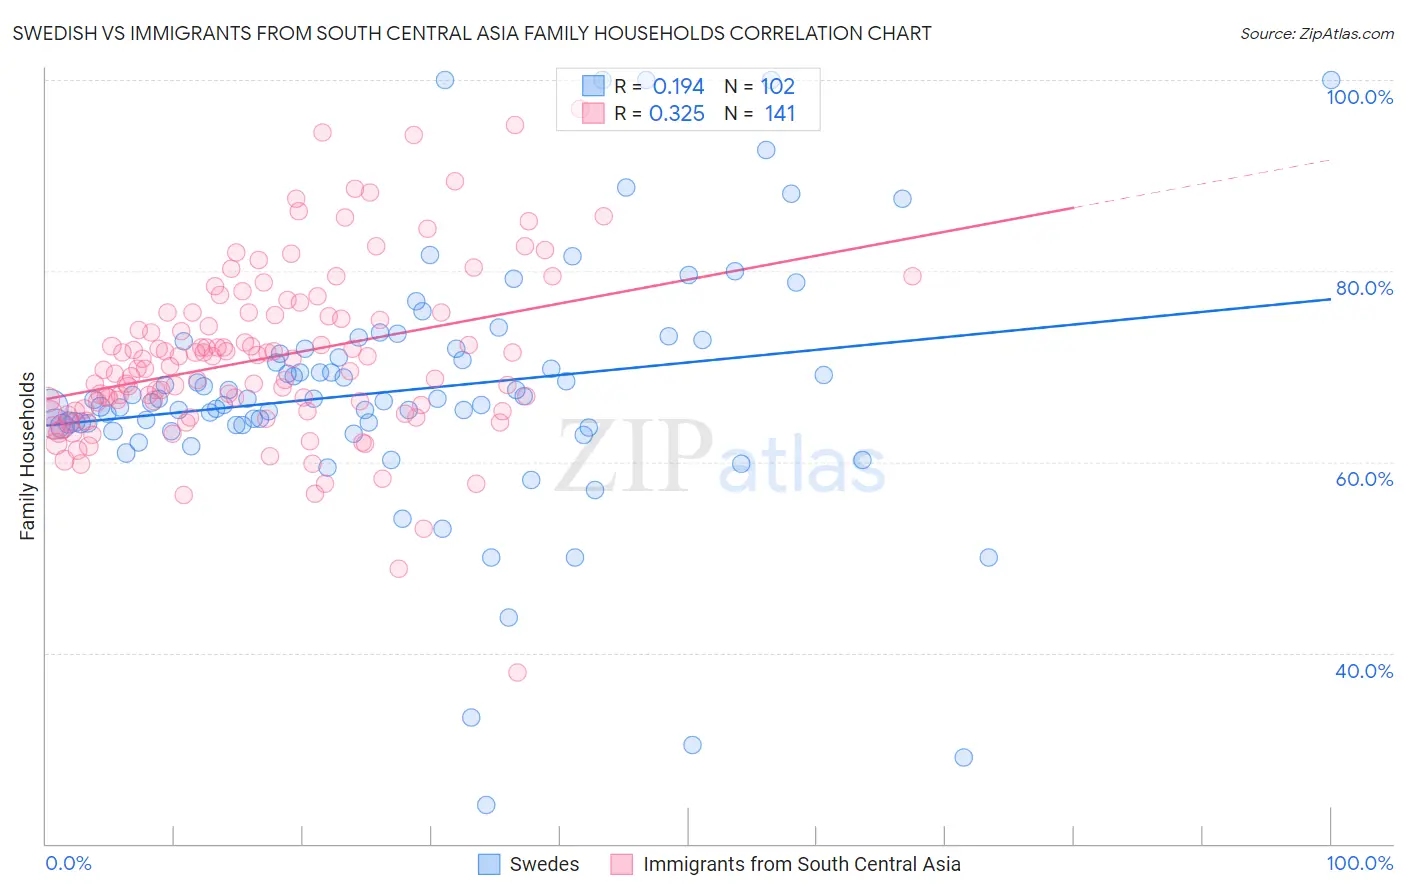
Swedish vs Immigrants from South Central Asia Family Households Correlation Chart
The statistical analysis conducted on geographies consisting of 538,762,235 people shows a poor positive correlation between the proportion of Swedes and percentage of family households in the United States with a correlation coefficient (R) of 0.194 and weighted average of 64.5%. Similarly, the statistical analysis conducted on geographies consisting of 472,677,474 people shows a mild positive correlation between the proportion of Immigrants from South Central Asia and percentage of family households in the United States with a correlation coefficient (R) of 0.325 and weighted average of 66.4%, a difference of 3.0%.
Family Households Correlation Summary
| Measurement | Swedish | Immigrants from South Central Asia |
| Minimum | 24.0% | 37.9% |
| Maximum | 100.0% | 97.0% |
| Range | 76.0% | 59.0% |
| Mean | 67.5% | 70.8% |
| Median | 66.4% | 69.8% |
| Interquartile 25% (IQ1) | 63.8% | 65.3% |
| Interquartile 75% (IQ3) | 71.8% | 75.5% |
| Interquartile Range (IQR) | 8.0% | 10.2% |
| Standard Deviation (Sample) | 13.1% | 9.0% |
| Standard Deviation (Population) | 13.0% | 9.0% |
Similar Demographics by Family Households
Demographics Similar to Swedes by Family Households
In terms of family households, the demographic groups most similar to Swedes are Scottish (64.5%, a difference of 0.020%), Austrian (64.5%, a difference of 0.020%), Uruguayan (64.5%, a difference of 0.030%), Czech (64.5%, a difference of 0.040%), and Canadian (64.4%, a difference of 0.050%).
| Demographics | Rating | Rank | Family Households |
| Immigrants | Romania | 77.0 /100 | #146 | Good 64.6% |
| Immigrants | Chile | 76.5 /100 | #147 | Good 64.6% |
| Delaware | 76.3 /100 | #148 | Good 64.6% |
| Sioux | 76.3 /100 | #149 | Good 64.6% |
| Romanians | 75.3 /100 | #150 | Good 64.5% |
| Syrians | 75.2 /100 | #151 | Good 64.5% |
| Scottish | 70.9 /100 | #152 | Good 64.5% |
| Swedes | 69.8 /100 | #153 | Good 64.5% |
| Austrians | 68.5 /100 | #154 | Good 64.5% |
| Uruguayans | 67.7 /100 | #155 | Good 64.5% |
| Czechs | 67.0 /100 | #156 | Good 64.5% |
| Canadians | 66.6 /100 | #157 | Good 64.4% |
| Lebanese | 66.4 /100 | #158 | Good 64.4% |
| Germans | 65.8 /100 | #159 | Good 64.4% |
| Immigrants | Moldova | 65.2 /100 | #160 | Good 64.4% |
Demographics Similar to Immigrants from South Central Asia by Family Households
In terms of family households, the demographic groups most similar to Immigrants from South Central Asia are Immigrants from Venezuela (66.4%, a difference of 0.050%), Bolivian (66.5%, a difference of 0.070%), Navajo (66.4%, a difference of 0.070%), Native/Alaskan (66.4%, a difference of 0.090%), and Arapaho (66.5%, a difference of 0.10%).
| Demographics | Rating | Rank | Family Households |
| Menominee | 100.0 /100 | #42 | Exceptional 66.5% |
| Apache | 100.0 /100 | #43 | Exceptional 66.5% |
| Asians | 100.0 /100 | #44 | Exceptional 66.5% |
| Venezuelans | 100.0 /100 | #45 | Exceptional 66.5% |
| Arapaho | 100.0 /100 | #46 | Exceptional 66.5% |
| Bolivians | 100.0 /100 | #47 | Exceptional 66.5% |
| Immigrants | Venezuela | 100.0 /100 | #48 | Exceptional 66.4% |
| Immigrants | South Central Asia | 100.0 /100 | #49 | Exceptional 66.4% |
| Navajo | 100.0 /100 | #50 | Exceptional 66.4% |
| Natives/Alaskans | 100.0 /100 | #51 | Exceptional 66.4% |
| Colombians | 100.0 /100 | #52 | Exceptional 66.3% |
| Afghans | 100.0 /100 | #53 | Exceptional 66.3% |
| Immigrants | Colombia | 100.0 /100 | #54 | Exceptional 66.3% |
| Immigrants | Immigrants | 100.0 /100 | #55 | Exceptional 66.1% |
| Immigrants | Hong Kong | 100.0 /100 | #56 | Exceptional 66.1% |