Swedish vs Dutch West Indian Male Unemployment
COMPARE
Swedish
Dutch West Indian
Male Unemployment
Male Unemployment Comparison
Swedes
Dutch West Indians
4.6%
MALE UNEMPLOYMENT
100.0/ 100
METRIC RATING
11th/ 347
METRIC RANK
5.8%
MALE UNEMPLOYMENT
0.1/ 100
METRIC RATING
258th/ 347
METRIC RANK
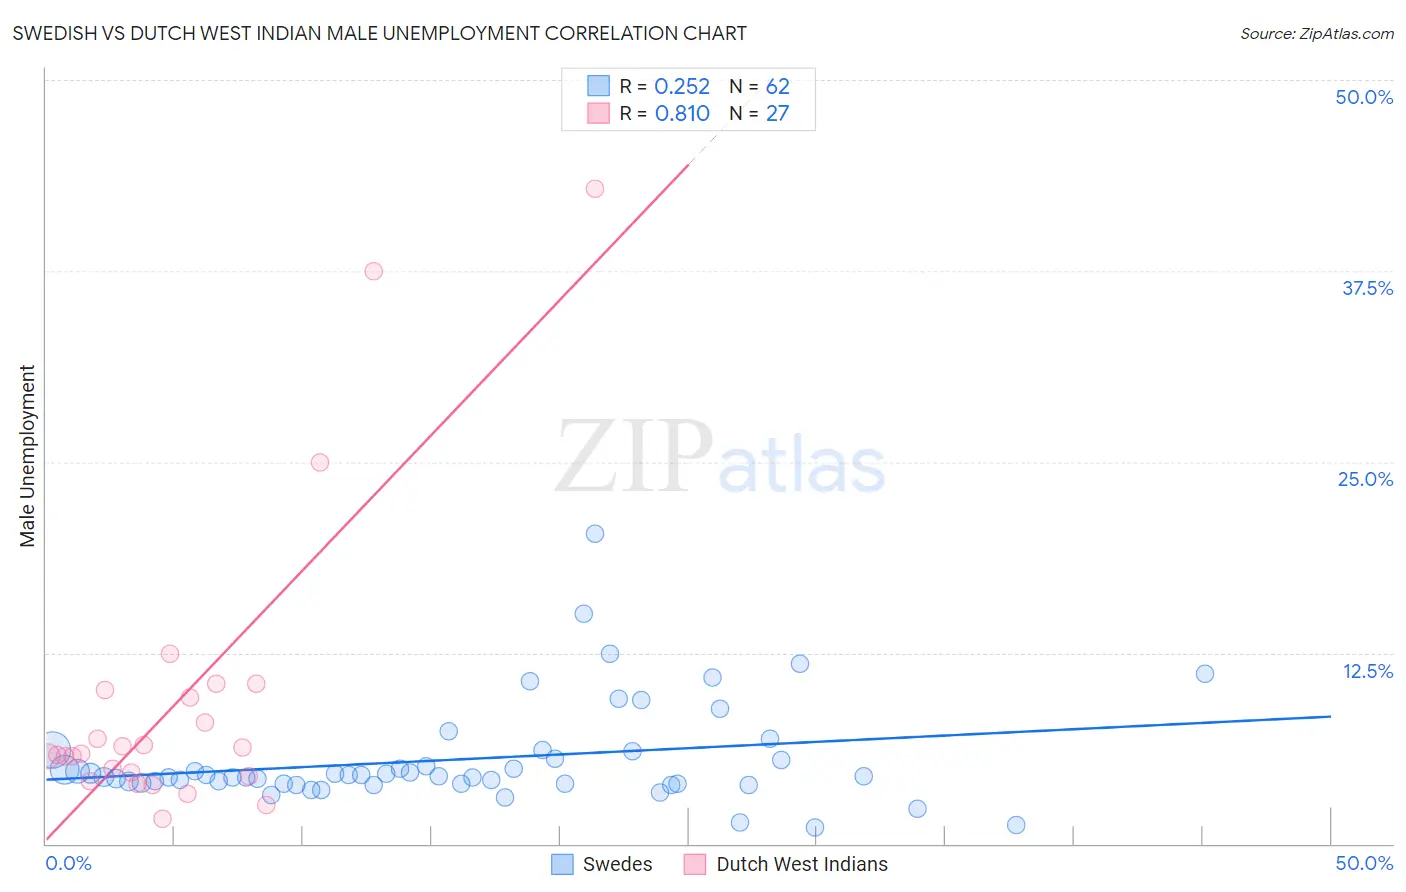
Swedish vs Dutch West Indian Male Unemployment Correlation Chart
The statistical analysis conducted on geographies consisting of 530,954,866 people shows a weak positive correlation between the proportion of Swedes and unemployment rate among males in the United States with a correlation coefficient (R) of 0.252 and weighted average of 4.6%. Similarly, the statistical analysis conducted on geographies consisting of 85,545,191 people shows a very strong positive correlation between the proportion of Dutch West Indians and unemployment rate among males in the United States with a correlation coefficient (R) of 0.810 and weighted average of 5.8%, a difference of 25.6%.
Male Unemployment Correlation Summary
| Measurement | Swedish | Dutch West Indian |
| Minimum | 1.1% | 1.6% |
| Maximum | 20.3% | 42.9% |
| Range | 19.2% | 41.3% |
| Mean | 5.5% | 9.4% |
| Median | 4.4% | 5.9% |
| Interquartile 25% (IQ1) | 3.9% | 4.4% |
| Interquartile 75% (IQ3) | 5.6% | 10.1% |
| Interquartile Range (IQR) | 1.7% | 5.7% |
| Standard Deviation (Sample) | 3.3% | 9.9% |
| Standard Deviation (Population) | 3.3% | 9.8% |
Similar Demographics by Male Unemployment
Demographics Similar to Swedes by Male Unemployment
In terms of male unemployment, the demographic groups most similar to Swedes are Cuban (4.6%, a difference of 0.20%), Immigrants from Bolivia (4.7%, a difference of 0.73%), Thai (4.6%, a difference of 0.81%), Bolivian (4.7%, a difference of 1.4%), and German (4.7%, a difference of 1.4%).
| Demographics | Rating | Rank | Male Unemployment |
| Immigrants | Venezuela | 100.0 /100 | #4 | Exceptional 4.4% |
| Danes | 100.0 /100 | #5 | Exceptional 4.5% |
| Venezuelans | 100.0 /100 | #6 | Exceptional 4.5% |
| Czechs | 100.0 /100 | #7 | Exceptional 4.5% |
| Luxembourgers | 100.0 /100 | #8 | Exceptional 4.5% |
| Thais | 100.0 /100 | #9 | Exceptional 4.6% |
| Cubans | 100.0 /100 | #10 | Exceptional 4.6% |
| Swedes | 100.0 /100 | #11 | Exceptional 4.6% |
| Immigrants | Bolivia | 100.0 /100 | #12 | Exceptional 4.7% |
| Bolivians | 100.0 /100 | #13 | Exceptional 4.7% |
| Germans | 100.0 /100 | #14 | Exceptional 4.7% |
| Scandinavians | 100.0 /100 | #15 | Exceptional 4.7% |
| Swiss | 99.9 /100 | #16 | Exceptional 4.7% |
| Filipinos | 99.9 /100 | #17 | Exceptional 4.7% |
| English | 99.9 /100 | #18 | Exceptional 4.8% |
Demographics Similar to Dutch West Indians by Male Unemployment
In terms of male unemployment, the demographic groups most similar to Dutch West Indians are Hispanic or Latino (5.8%, a difference of 0.14%), Cajun (5.8%, a difference of 0.15%), Immigrants from Central America (5.8%, a difference of 0.21%), Comanche (5.8%, a difference of 0.30%), and Kiowa (5.8%, a difference of 0.38%).
| Demographics | Rating | Rank | Male Unemployment |
| Spanish Americans | 0.3 /100 | #251 | Tragic 5.7% |
| Mexicans | 0.2 /100 | #252 | Tragic 5.8% |
| Mexican American Indians | 0.2 /100 | #253 | Tragic 5.8% |
| Japanese | 0.2 /100 | #254 | Tragic 5.8% |
| Kiowa | 0.2 /100 | #255 | Tragic 5.8% |
| Comanche | 0.2 /100 | #256 | Tragic 5.8% |
| Hispanics or Latinos | 0.1 /100 | #257 | Tragic 5.8% |
| Dutch West Indians | 0.1 /100 | #258 | Tragic 5.8% |
| Cajuns | 0.1 /100 | #259 | Tragic 5.8% |
| Immigrants | Central America | 0.1 /100 | #260 | Tragic 5.8% |
| Liberians | 0.1 /100 | #261 | Tragic 5.8% |
| Immigrants | Portugal | 0.1 /100 | #262 | Tragic 5.9% |
| Immigrants | Latin America | 0.1 /100 | #263 | Tragic 5.9% |
| Immigrants | Mexico | 0.0 /100 | #264 | Tragic 5.9% |
| French American Indians | 0.0 /100 | #265 | Tragic 5.9% |