Immigrants from Lebanon vs Crow Currently Married
COMPARE
Immigrants from Lebanon
Crow
Currently Married
Currently Married Comparison
Immigrants from Lebanon
Crow
48.2%
CURRENTLY MARRIED
97.6/ 100
METRIC RATING
72nd/ 347
METRIC RANK
40.4%
CURRENTLY MARRIED
0.0/ 100
METRIC RATING
329th/ 347
METRIC RANK
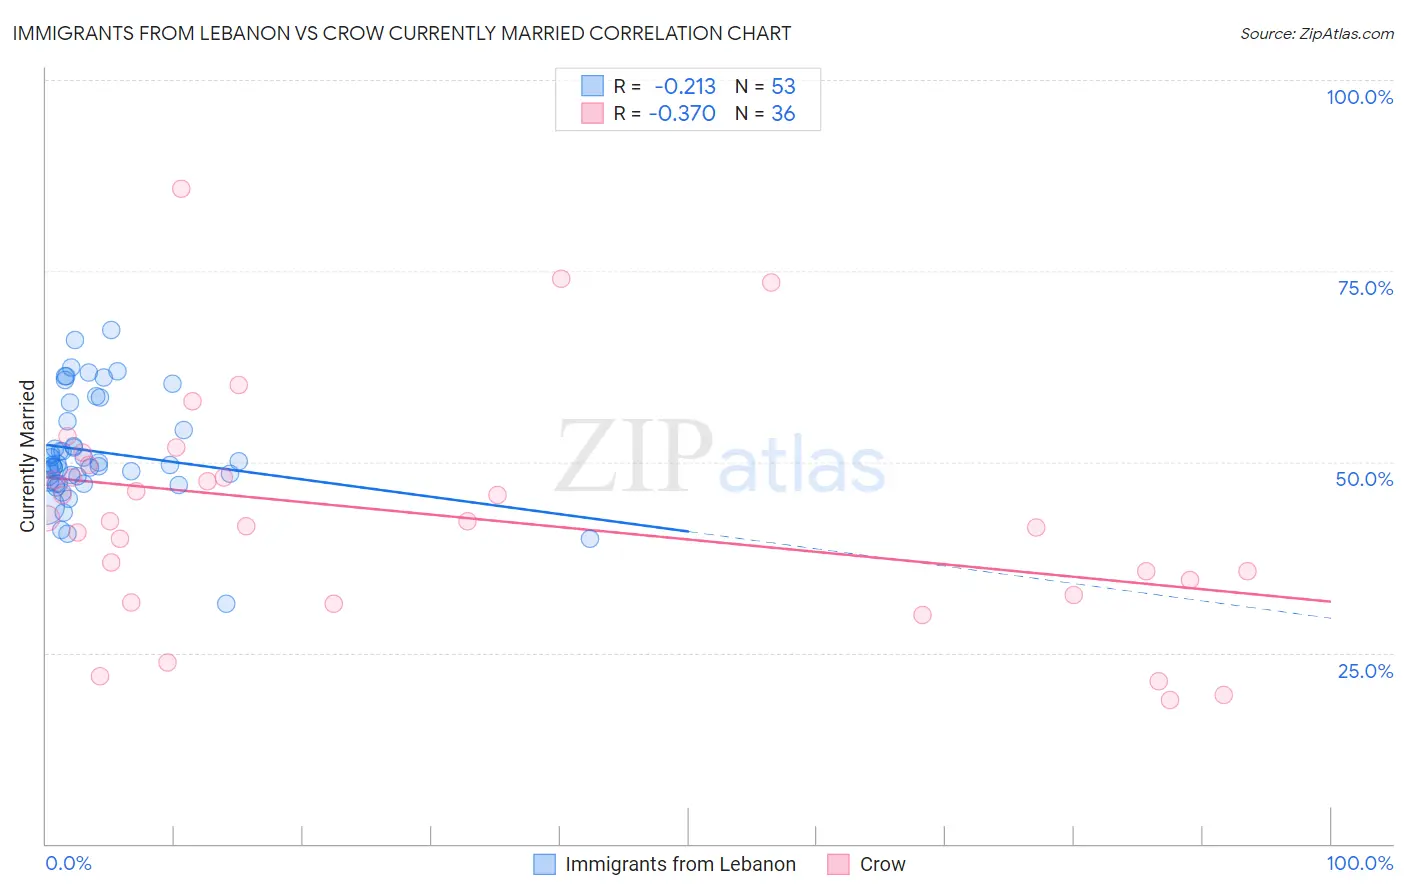
Immigrants from Lebanon vs Crow Currently Married Correlation Chart
The statistical analysis conducted on geographies consisting of 217,155,711 people shows a weak negative correlation between the proportion of Immigrants from Lebanon and percentage of population currently married in the United States with a correlation coefficient (R) of -0.213 and weighted average of 48.2%. Similarly, the statistical analysis conducted on geographies consisting of 59,208,662 people shows a mild negative correlation between the proportion of Crow and percentage of population currently married in the United States with a correlation coefficient (R) of -0.370 and weighted average of 40.4%, a difference of 19.4%.
Currently Married Correlation Summary
| Measurement | Immigrants from Lebanon | Crow |
| Minimum | 31.4% | 18.8% |
| Maximum | 67.2% | 85.8% |
| Range | 35.8% | 67.0% |
| Mean | 51.3% | 43.0% |
| Median | 49.7% | 42.2% |
| Interquartile 25% (IQ1) | 47.4% | 33.5% |
| Interquartile 75% (IQ3) | 56.5% | 48.8% |
| Interquartile Range (IQR) | 9.2% | 15.3% |
| Standard Deviation (Sample) | 7.0% | 15.0% |
| Standard Deviation (Population) | 6.9% | 14.8% |
Similar Demographics by Currently Married
Demographics Similar to Immigrants from Lebanon by Currently Married
In terms of currently married, the demographic groups most similar to Immigrants from Lebanon are Immigrants from Eastern Asia (48.2%, a difference of 0.020%), Estonian (48.2%, a difference of 0.050%), Immigrants from Belarus (48.1%, a difference of 0.12%), Macedonian (48.3%, a difference of 0.14%), and Basque (48.1%, a difference of 0.14%).
| Demographics | Rating | Rank | Currently Married |
| Ukrainians | 98.3 /100 | #65 | Exceptional 48.4% |
| Tongans | 98.2 /100 | #66 | Exceptional 48.3% |
| Slovaks | 98.2 /100 | #67 | Exceptional 48.3% |
| Immigrants | England | 98.2 /100 | #68 | Exceptional 48.3% |
| Canadians | 98.1 /100 | #69 | Exceptional 48.3% |
| Immigrants | Asia | 97.9 /100 | #70 | Exceptional 48.3% |
| Macedonians | 97.9 /100 | #71 | Exceptional 48.3% |
| Immigrants | Lebanon | 97.6 /100 | #72 | Exceptional 48.2% |
| Immigrants | Eastern Asia | 97.5 /100 | #73 | Exceptional 48.2% |
| Estonians | 97.4 /100 | #74 | Exceptional 48.2% |
| Immigrants | Belarus | 97.2 /100 | #75 | Exceptional 48.1% |
| Basques | 97.2 /100 | #76 | Exceptional 48.1% |
| Slovenes | 97.1 /100 | #77 | Exceptional 48.1% |
| Immigrants | Belgium | 97.1 /100 | #78 | Exceptional 48.1% |
| Immigrants | South Africa | 97.0 /100 | #79 | Exceptional 48.1% |
Demographics Similar to Crow by Currently Married
In terms of currently married, the demographic groups most similar to Crow are Immigrants from Dominica (40.3%, a difference of 0.090%), Immigrants from Barbados (40.3%, a difference of 0.10%), Arapaho (40.5%, a difference of 0.43%), Senegalese (40.6%, a difference of 0.47%), and Barbadian (40.6%, a difference of 0.65%).
| Demographics | Rating | Rank | Currently Married |
| Immigrants | Haiti | 0.0 /100 | #322 | Tragic 41.0% |
| Immigrants | West Indies | 0.0 /100 | #323 | Tragic 40.7% |
| Immigrants | Senegal | 0.0 /100 | #324 | Tragic 40.7% |
| U.S. Virgin Islanders | 0.0 /100 | #325 | Tragic 40.7% |
| Barbadians | 0.0 /100 | #326 | Tragic 40.6% |
| Senegalese | 0.0 /100 | #327 | Tragic 40.6% |
| Arapaho | 0.0 /100 | #328 | Tragic 40.5% |
| Crow | 0.0 /100 | #329 | Tragic 40.4% |
| Immigrants | Dominica | 0.0 /100 | #330 | Tragic 40.3% |
| Immigrants | Barbados | 0.0 /100 | #331 | Tragic 40.3% |
| Immigrants | St. Vincent and the Grenadines | 0.0 /100 | #332 | Tragic 40.1% |
| Yup'ik | 0.0 /100 | #333 | Tragic 39.9% |
| Puerto Ricans | 0.0 /100 | #334 | Tragic 39.9% |
| Lumbee | 0.0 /100 | #335 | Tragic 39.8% |
| British West Indians | 0.0 /100 | #336 | Tragic 39.8% |