Immigrants from South Africa vs South American Indian Single Mother Households
COMPARE
Immigrants from South Africa
South American Indian
Single Mother Households
Single Mother Households Comparison
Immigrants from South Africa
South American Indians
5.7%
SINGLE MOTHER HOUSEHOLDS
96.3/ 100
METRIC RATING
98th/ 347
METRIC RANK
6.4%
SINGLE MOTHER HOUSEHOLDS
33.4/ 100
METRIC RATING
182nd/ 347
METRIC RANK
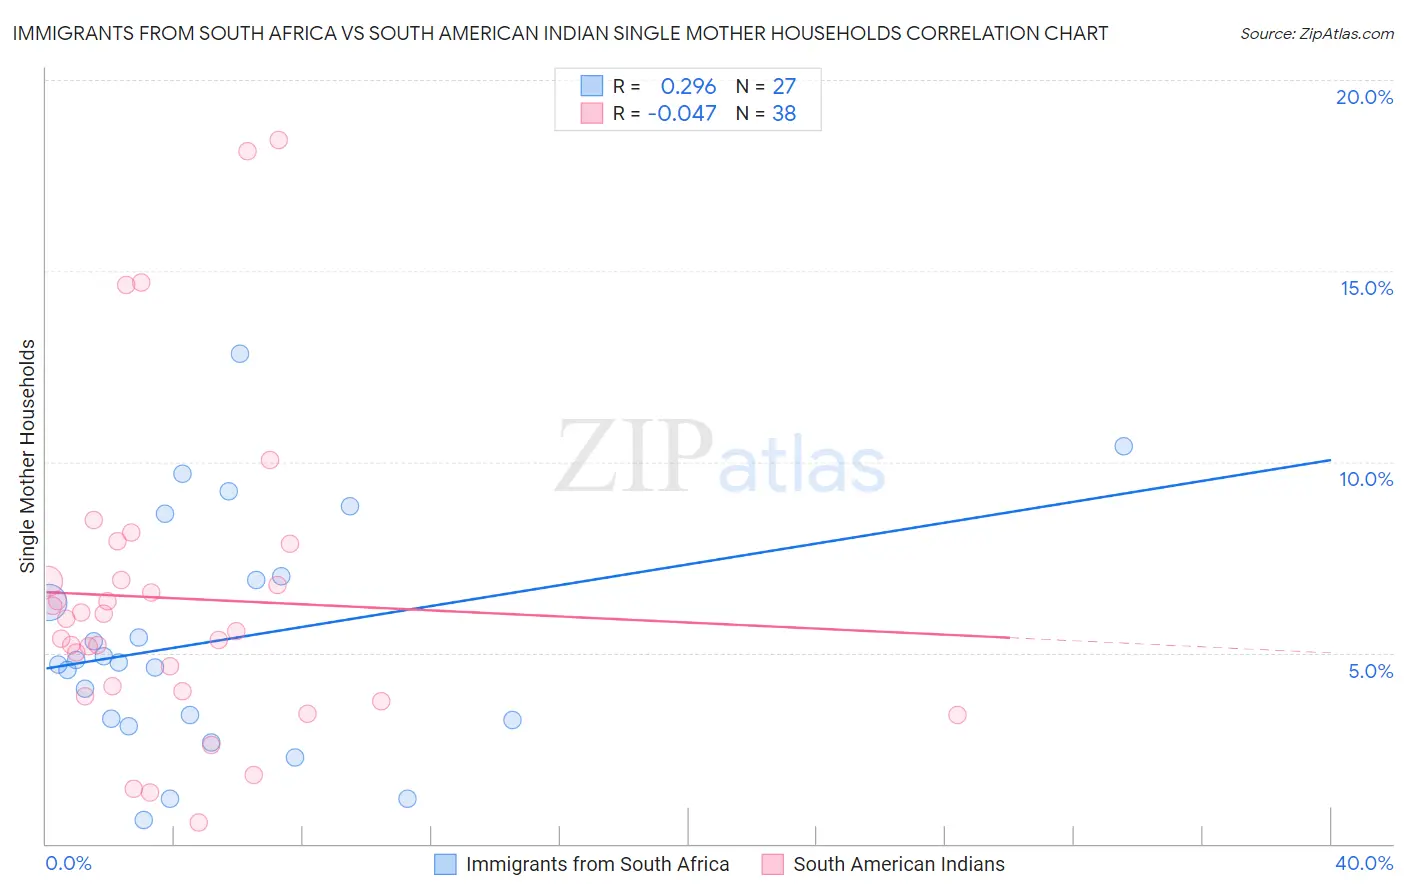
Immigrants from South Africa vs South American Indian Single Mother Households Correlation Chart
The statistical analysis conducted on geographies consisting of 232,880,827 people shows a weak positive correlation between the proportion of Immigrants from South Africa and percentage of single mother households in the United States with a correlation coefficient (R) of 0.296 and weighted average of 5.7%. Similarly, the statistical analysis conducted on geographies consisting of 164,464,309 people shows no correlation between the proportion of South American Indians and percentage of single mother households in the United States with a correlation coefficient (R) of -0.047 and weighted average of 6.4%, a difference of 11.9%.
Single Mother Households Correlation Summary
| Measurement | Immigrants from South Africa | South American Indian |
| Minimum | 0.63% | 0.55% |
| Maximum | 12.8% | 18.4% |
| Range | 12.2% | 17.9% |
| Mean | 5.3% | 6.4% |
| Median | 4.8% | 5.7% |
| Interquartile 25% (IQ1) | 3.3% | 4.0% |
| Interquartile 75% (IQ3) | 7.0% | 6.9% |
| Interquartile Range (IQR) | 3.8% | 2.9% |
| Standard Deviation (Sample) | 3.0% | 4.1% |
| Standard Deviation (Population) | 3.0% | 4.0% |
Similar Demographics by Single Mother Households
Demographics Similar to Immigrants from South Africa by Single Mother Households
In terms of single mother households, the demographic groups most similar to Immigrants from South Africa are Tlingit-Haida (5.7%, a difference of 0.040%), Immigrants from Poland (5.8%, a difference of 0.050%), Scandinavian (5.8%, a difference of 0.070%), Austrian (5.7%, a difference of 0.090%), and German (5.8%, a difference of 0.10%).
| Demographics | Rating | Rank | Single Mother Households |
| Europeans | 97.0 /100 | #91 | Exceptional 5.7% |
| Immigrants | Western Asia | 96.7 /100 | #92 | Exceptional 5.7% |
| Serbians | 96.7 /100 | #93 | Exceptional 5.7% |
| Basques | 96.7 /100 | #94 | Exceptional 5.7% |
| Slovaks | 96.6 /100 | #95 | Exceptional 5.7% |
| Austrians | 96.4 /100 | #96 | Exceptional 5.7% |
| Tlingit-Haida | 96.4 /100 | #97 | Exceptional 5.7% |
| Immigrants | South Africa | 96.3 /100 | #98 | Exceptional 5.7% |
| Immigrants | Poland | 96.3 /100 | #99 | Exceptional 5.8% |
| Scandinavians | 96.2 /100 | #100 | Exceptional 5.8% |
| Germans | 96.2 /100 | #101 | Exceptional 5.8% |
| English | 96.2 /100 | #102 | Exceptional 5.8% |
| Scottish | 96.2 /100 | #103 | Exceptional 5.8% |
| Northern Europeans | 96.2 /100 | #104 | Exceptional 5.8% |
| Taiwanese | 96.1 /100 | #105 | Exceptional 5.8% |
Demographics Similar to South American Indians by Single Mother Households
In terms of single mother households, the demographic groups most similar to South American Indians are Spanish (6.4%, a difference of 0.0%), Immigrants from Nepal (6.4%, a difference of 0.32%), Spaniard (6.5%, a difference of 0.70%), Hmong (6.4%, a difference of 0.75%), and Portuguese (6.4%, a difference of 0.77%).
| Demographics | Rating | Rank | Single Mother Households |
| Marshallese | 45.8 /100 | #175 | Average 6.3% |
| Immigrants | Bosnia and Herzegovina | 44.3 /100 | #176 | Average 6.3% |
| Osage | 43.0 /100 | #177 | Average 6.4% |
| Portuguese | 40.0 /100 | #178 | Fair 6.4% |
| Hmong | 39.8 /100 | #179 | Fair 6.4% |
| Immigrants | Nepal | 36.1 /100 | #180 | Fair 6.4% |
| Spanish | 33.4 /100 | #181 | Fair 6.4% |
| South American Indians | 33.4 /100 | #182 | Fair 6.4% |
| Spaniards | 27.8 /100 | #183 | Fair 6.5% |
| Ethiopians | 26.0 /100 | #184 | Fair 6.5% |
| Ugandans | 25.6 /100 | #185 | Fair 6.5% |
| Costa Ricans | 24.8 /100 | #186 | Fair 6.5% |
| Immigrants | Afghanistan | 24.7 /100 | #187 | Fair 6.5% |
| Ottawa | 23.8 /100 | #188 | Fair 6.5% |
| Delaware | 23.3 /100 | #189 | Fair 6.5% |