South African vs Czech Single Father Households
COMPARE
South African
Czech
Single Father Households
Single Father Households Comparison
South Africans
Czechs
2.1%
SINGLE FATHER HOUSEHOLDS
99.1/ 100
METRIC RATING
99th/ 347
METRIC RANK
2.3%
SINGLE FATHER HOUSEHOLDS
62.5/ 100
METRIC RATING
169th/ 347
METRIC RANK
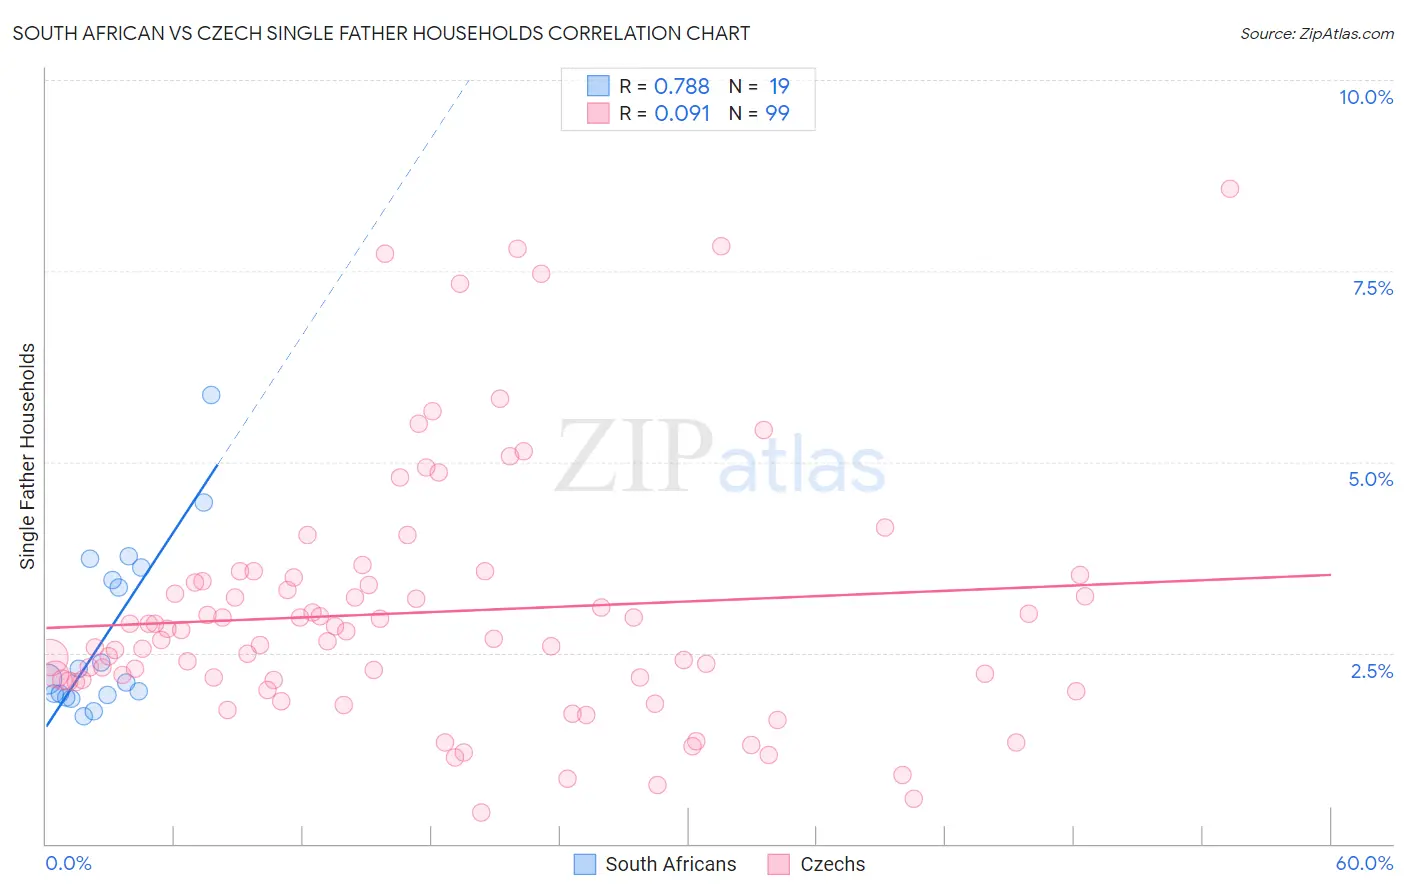
South African vs Czech Single Father Households Correlation Chart
The statistical analysis conducted on geographies consisting of 181,721,596 people shows a strong positive correlation between the proportion of South Africans and percentage of single father households in the United States with a correlation coefficient (R) of 0.788 and weighted average of 2.1%. Similarly, the statistical analysis conducted on geographies consisting of 477,253,750 people shows a slight positive correlation between the proportion of Czechs and percentage of single father households in the United States with a correlation coefficient (R) of 0.091 and weighted average of 2.3%, a difference of 8.3%.
Single Father Households Correlation Summary
| Measurement | South African | Czech |
| Minimum | 1.7% | 0.41% |
| Maximum | 5.9% | 8.6% |
| Range | 4.2% | 8.2% |
| Mean | 2.8% | 3.0% |
| Median | 2.2% | 2.7% |
| Interquartile 25% (IQ1) | 1.9% | 2.1% |
| Interquartile 75% (IQ3) | 3.6% | 3.4% |
| Interquartile Range (IQR) | 1.7% | 1.3% |
| Standard Deviation (Sample) | 1.1% | 1.7% |
| Standard Deviation (Population) | 1.1% | 1.6% |
Similar Demographics by Single Father Households
Demographics Similar to South Africans by Single Father Households
In terms of single father households, the demographic groups most similar to South Africans are Guyanese (2.1%, a difference of 0.040%), Immigrants from Northern Africa (2.1%, a difference of 0.15%), Immigrants from Moldova (2.1%, a difference of 0.17%), Arab (2.1%, a difference of 0.30%), and Immigrants from Western Europe (2.1%, a difference of 0.30%).
| Demographics | Rating | Rank | Single Father Households |
| Romanians | 99.4 /100 | #92 | Exceptional 2.1% |
| Croatians | 99.3 /100 | #93 | Exceptional 2.1% |
| Ukrainians | 99.3 /100 | #94 | Exceptional 2.1% |
| Bermudans | 99.2 /100 | #95 | Exceptional 2.1% |
| Arabs | 99.2 /100 | #96 | Exceptional 2.1% |
| Immigrants | Moldova | 99.1 /100 | #97 | Exceptional 2.1% |
| Guyanese | 99.1 /100 | #98 | Exceptional 2.1% |
| South Africans | 99.1 /100 | #99 | Exceptional 2.1% |
| Immigrants | Northern Africa | 99.0 /100 | #100 | Exceptional 2.1% |
| Immigrants | Western Europe | 98.9 /100 | #101 | Exceptional 2.1% |
| Argentineans | 98.9 /100 | #102 | Exceptional 2.1% |
| Lebanese | 98.9 /100 | #103 | Exceptional 2.1% |
| Alsatians | 98.9 /100 | #104 | Exceptional 2.1% |
| Palestinians | 98.6 /100 | #105 | Exceptional 2.2% |
| Immigrants | Southern Europe | 98.6 /100 | #106 | Exceptional 2.2% |
Demographics Similar to Czechs by Single Father Households
In terms of single father households, the demographic groups most similar to Czechs are Ugandan (2.3%, a difference of 0.020%), Icelander (2.3%, a difference of 0.040%), Swedish (2.3%, a difference of 0.070%), South American (2.3%, a difference of 0.14%), and Czechoslovakian (2.3%, a difference of 0.29%).
| Demographics | Rating | Rank | Single Father Households |
| Scottish | 72.8 /100 | #162 | Good 2.3% |
| Irish | 72.1 /100 | #163 | Good 2.3% |
| Pakistanis | 70.6 /100 | #164 | Good 2.3% |
| Scotch-Irish | 69.4 /100 | #165 | Good 2.3% |
| English | 68.6 /100 | #166 | Good 2.3% |
| South Americans | 64.3 /100 | #167 | Good 2.3% |
| Icelanders | 63.1 /100 | #168 | Good 2.3% |
| Czechs | 62.5 /100 | #169 | Good 2.3% |
| Ugandans | 62.2 /100 | #170 | Good 2.3% |
| Swedes | 61.6 /100 | #171 | Good 2.3% |
| Czechoslovakians | 58.9 /100 | #172 | Average 2.3% |
| Celtics | 55.4 /100 | #173 | Average 2.3% |
| Afghans | 50.0 /100 | #174 | Average 2.3% |
| Immigrants | Jamaica | 49.1 /100 | #175 | Average 2.3% |
| Danes | 48.2 /100 | #176 | Average 2.3% |