Greek vs Immigrants from Congo Family Households with Children
COMPARE
Greek
Immigrants from Congo
Family Households with Children
Family Households with Children Comparison
Greeks
Immigrants from Congo
27.1%
FAMILY HOUSEHOLDS WITH CHILDREN
11.4/ 100
METRIC RATING
218th/ 347
METRIC RANK
27.3%
FAMILY HOUSEHOLDS WITH CHILDREN
28.7/ 100
METRIC RATING
200th/ 347
METRIC RANK
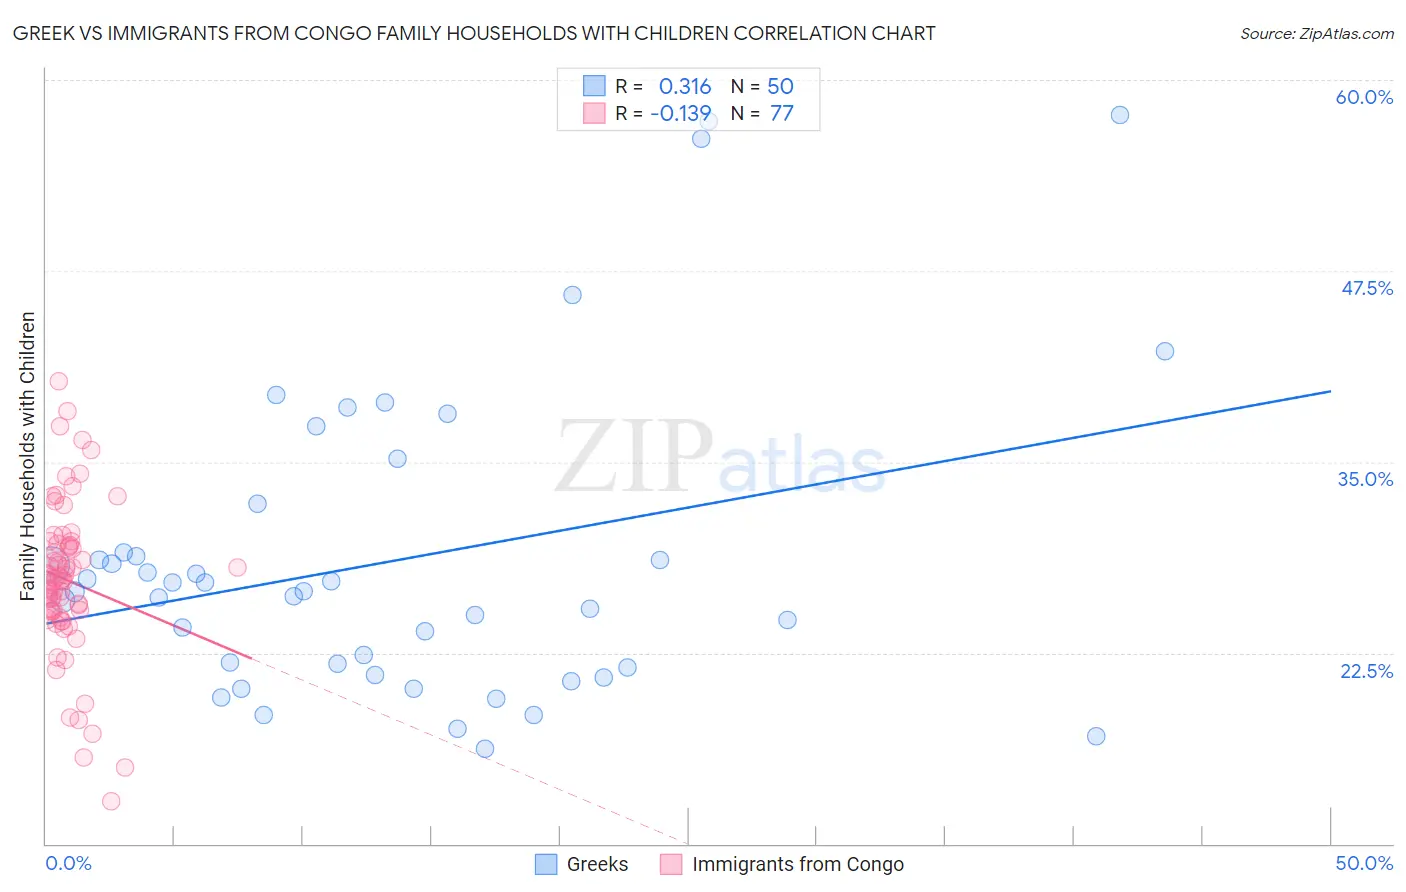
Greek vs Immigrants from Congo Family Households with Children Correlation Chart
The statistical analysis conducted on geographies consisting of 482,098,294 people shows a mild positive correlation between the proportion of Greeks and percentage of family households with children in the United States with a correlation coefficient (R) of 0.316 and weighted average of 27.1%. Similarly, the statistical analysis conducted on geographies consisting of 92,083,447 people shows a poor negative correlation between the proportion of Immigrants from Congo and percentage of family households with children in the United States with a correlation coefficient (R) of -0.139 and weighted average of 27.3%, a difference of 0.64%.
Family Households with Children Correlation Summary
| Measurement | Greek | Immigrants from Congo |
| Minimum | 16.2% | 12.8% |
| Maximum | 57.7% | 40.2% |
| Range | 41.5% | 27.4% |
| Mean | 28.5% | 27.3% |
| Median | 26.5% | 27.3% |
| Interquartile 25% (IQ1) | 21.5% | 25.2% |
| Interquartile 75% (IQ3) | 29.1% | 29.6% |
| Interquartile Range (IQR) | 7.6% | 4.4% |
| Standard Deviation (Sample) | 10.0% | 5.0% |
| Standard Deviation (Population) | 9.9% | 5.0% |
Demographics Similar to Greeks and Immigrants from Congo by Family Households with Children
In terms of family households with children, the demographic groups most similar to Greeks are Cuban (27.1%, a difference of 0.040%), U.S. Virgin Islander (27.1%, a difference of 0.040%), Immigrants from Japan (27.1%, a difference of 0.040%), African (27.2%, a difference of 0.080%), and Northern European (27.2%, a difference of 0.080%). Similarly, the demographic groups most similar to Immigrants from Congo are English (27.3%, a difference of 0.090%), Bhutanese (27.3%, a difference of 0.10%), American (27.3%, a difference of 0.17%), Kiowa (27.3%, a difference of 0.19%), and Immigrants from Sudan (27.3%, a difference of 0.21%).
| Demographics | Rating | Rank | Family Households with Children |
| English | 32.0 /100 | #199 | Fair 27.3% |
| Immigrants | Congo | 28.7 /100 | #200 | Fair 27.3% |
| Bhutanese | 25.1 /100 | #201 | Fair 27.3% |
| Americans | 22.8 /100 | #202 | Fair 27.3% |
| Kiowa | 22.2 /100 | #203 | Fair 27.3% |
| Immigrants | Sudan | 21.6 /100 | #204 | Fair 27.3% |
| Immigrants | Haiti | 20.3 /100 | #205 | Fair 27.2% |
| Immigrants | Micronesia | 20.2 /100 | #206 | Fair 27.2% |
| Haitians | 19.8 /100 | #207 | Poor 27.2% |
| Immigrants | Poland | 16.4 /100 | #208 | Poor 27.2% |
| Dutch West Indians | 15.8 /100 | #209 | Poor 27.2% |
| Immigrants | Ukraine | 14.4 /100 | #210 | Poor 27.2% |
| Welsh | 14.2 /100 | #211 | Poor 27.2% |
| Immigrants | Dominica | 13.9 /100 | #212 | Poor 27.2% |
| Okinawans | 13.7 /100 | #213 | Poor 27.2% |
| Africans | 13.0 /100 | #214 | Poor 27.2% |
| Northern Europeans | 12.8 /100 | #215 | Poor 27.2% |
| Cubans | 12.2 /100 | #216 | Poor 27.1% |
| U.S. Virgin Islanders | 12.1 /100 | #217 | Poor 27.1% |
| Greeks | 11.4 /100 | #218 | Poor 27.1% |
| Immigrants | Japan | 10.7 /100 | #219 | Poor 27.1% |