Spanish American vs Malaysian Family Households with Children
COMPARE
Spanish American
Malaysian
Family Households with Children
Family Households with Children Comparison
Spanish Americans
Malaysians
27.4%
FAMILY HOUSEHOLDS WITH CHILDREN
48.9/ 100
METRIC RATING
178th/ 347
METRIC RANK
29.8%
FAMILY HOUSEHOLDS WITH CHILDREN
100.0/ 100
METRIC RATING
22nd/ 347
METRIC RANK
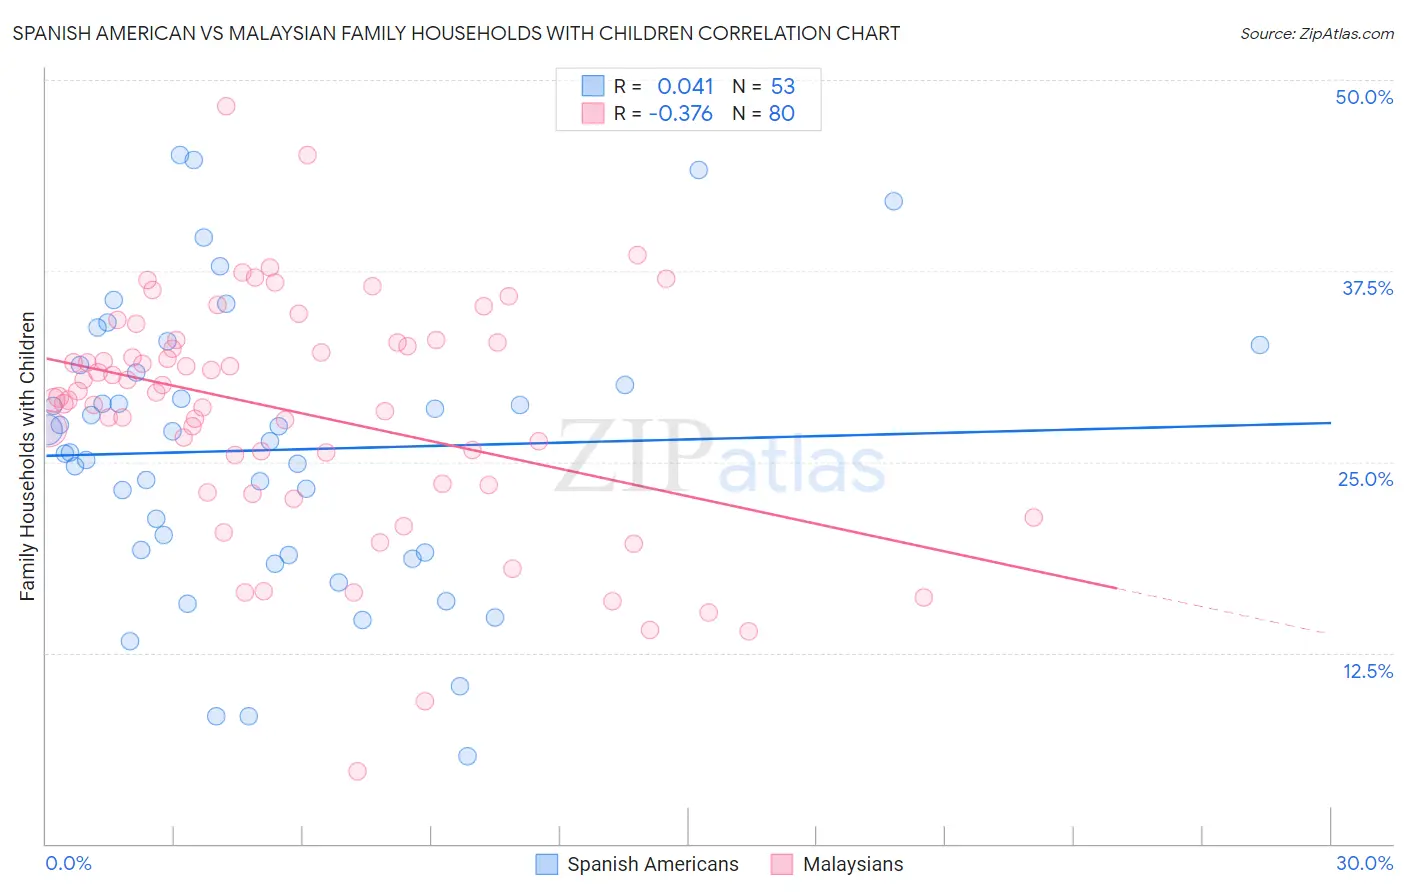
Spanish American vs Malaysian Family Households with Children Correlation Chart
The statistical analysis conducted on geographies consisting of 103,165,660 people shows no correlation between the proportion of Spanish Americans and percentage of family households with children in the United States with a correlation coefficient (R) of 0.041 and weighted average of 27.4%. Similarly, the statistical analysis conducted on geographies consisting of 225,942,308 people shows a mild negative correlation between the proportion of Malaysians and percentage of family households with children in the United States with a correlation coefficient (R) of -0.376 and weighted average of 29.8%, a difference of 8.7%.
Family Households with Children Correlation Summary
| Measurement | Spanish American | Malaysian |
| Minimum | 5.7% | 4.8% |
| Maximum | 45.1% | 48.3% |
| Range | 39.4% | 43.6% |
| Mean | 25.8% | 28.2% |
| Median | 26.3% | 29.4% |
| Interquartile 25% (IQ1) | 19.0% | 23.6% |
| Interquartile 75% (IQ3) | 31.1% | 32.8% |
| Interquartile Range (IQR) | 12.1% | 9.3% |
| Standard Deviation (Sample) | 9.3% | 7.7% |
| Standard Deviation (Population) | 9.2% | 7.7% |
Similar Demographics by Family Households with Children
Demographics Similar to Spanish Americans by Family Households with Children
In terms of family households with children, the demographic groups most similar to Spanish Americans are Ugandan (27.4%, a difference of 0.010%), White/Caucasian (27.4%, a difference of 0.020%), British (27.4%, a difference of 0.020%), Immigrants from China (27.4%, a difference of 0.020%), and Turkish (27.4%, a difference of 0.040%).
| Demographics | Rating | Rank | Family Households with Children |
| Blackfeet | 54.3 /100 | #171 | Average 27.5% |
| Israelis | 53.9 /100 | #172 | Average 27.5% |
| Immigrants | Argentina | 52.2 /100 | #173 | Average 27.5% |
| Whites/Caucasians | 50.0 /100 | #174 | Average 27.4% |
| British | 49.9 /100 | #175 | Average 27.4% |
| Immigrants | China | 49.6 /100 | #176 | Average 27.4% |
| Ugandans | 49.2 /100 | #177 | Average 27.4% |
| Spanish Americans | 48.9 /100 | #178 | Average 27.4% |
| Turks | 46.9 /100 | #179 | Average 27.4% |
| Immigrants | Turkey | 46.9 /100 | #180 | Average 27.4% |
| Aleuts | 46.7 /100 | #181 | Average 27.4% |
| Puget Sound Salish | 46.2 /100 | #182 | Average 27.4% |
| South Africans | 44.9 /100 | #183 | Average 27.4% |
| Native Hawaiians | 44.6 /100 | #184 | Average 27.4% |
| Delaware | 42.0 /100 | #185 | Average 27.4% |
Demographics Similar to Malaysians by Family Households with Children
In terms of family households with children, the demographic groups most similar to Malaysians are Immigrants from Laos (29.8%, a difference of 0.030%), Immigrants from El Salvador (29.8%, a difference of 0.080%), Alaska Native (29.9%, a difference of 0.11%), Salvadoran (29.9%, a difference of 0.14%), and Mexican American Indian (29.7%, a difference of 0.27%).
| Demographics | Rating | Rank | Family Households with Children |
| Immigrants | South Central Asia | 100.0 /100 | #15 | Exceptional 30.0% |
| Immigrants | Afghanistan | 100.0 /100 | #16 | Exceptional 30.0% |
| Hispanics or Latinos | 100.0 /100 | #17 | Exceptional 29.9% |
| Salvadorans | 100.0 /100 | #18 | Exceptional 29.9% |
| Alaska Natives | 100.0 /100 | #19 | Exceptional 29.9% |
| Immigrants | El Salvador | 100.0 /100 | #20 | Exceptional 29.8% |
| Immigrants | Laos | 100.0 /100 | #21 | Exceptional 29.8% |
| Malaysians | 100.0 /100 | #22 | Exceptional 29.8% |
| Mexican American Indians | 100.0 /100 | #23 | Exceptional 29.7% |
| Guamanians/Chamorros | 100.0 /100 | #24 | Exceptional 29.7% |
| Immigrants | Latin America | 100.0 /100 | #25 | Exceptional 29.7% |
| Sri Lankans | 100.0 /100 | #26 | Exceptional 29.5% |
| Immigrants | Vietnam | 100.0 /100 | #27 | Exceptional 29.5% |
| Samoans | 100.0 /100 | #28 | Exceptional 29.5% |
| Bolivians | 100.0 /100 | #29 | Exceptional 29.5% |