Spanish American vs Immigrants from Albania 4th Grade
COMPARE
Spanish American
Immigrants from Albania
4th Grade
4th Grade Comparison
Spanish Americans
Immigrants from Albania
97.5%
4TH GRADE
39.3/ 100
METRIC RATING
182nd/ 347
METRIC RANK
97.4%
4TH GRADE
27.7/ 100
METRIC RATING
196th/ 347
METRIC RANK
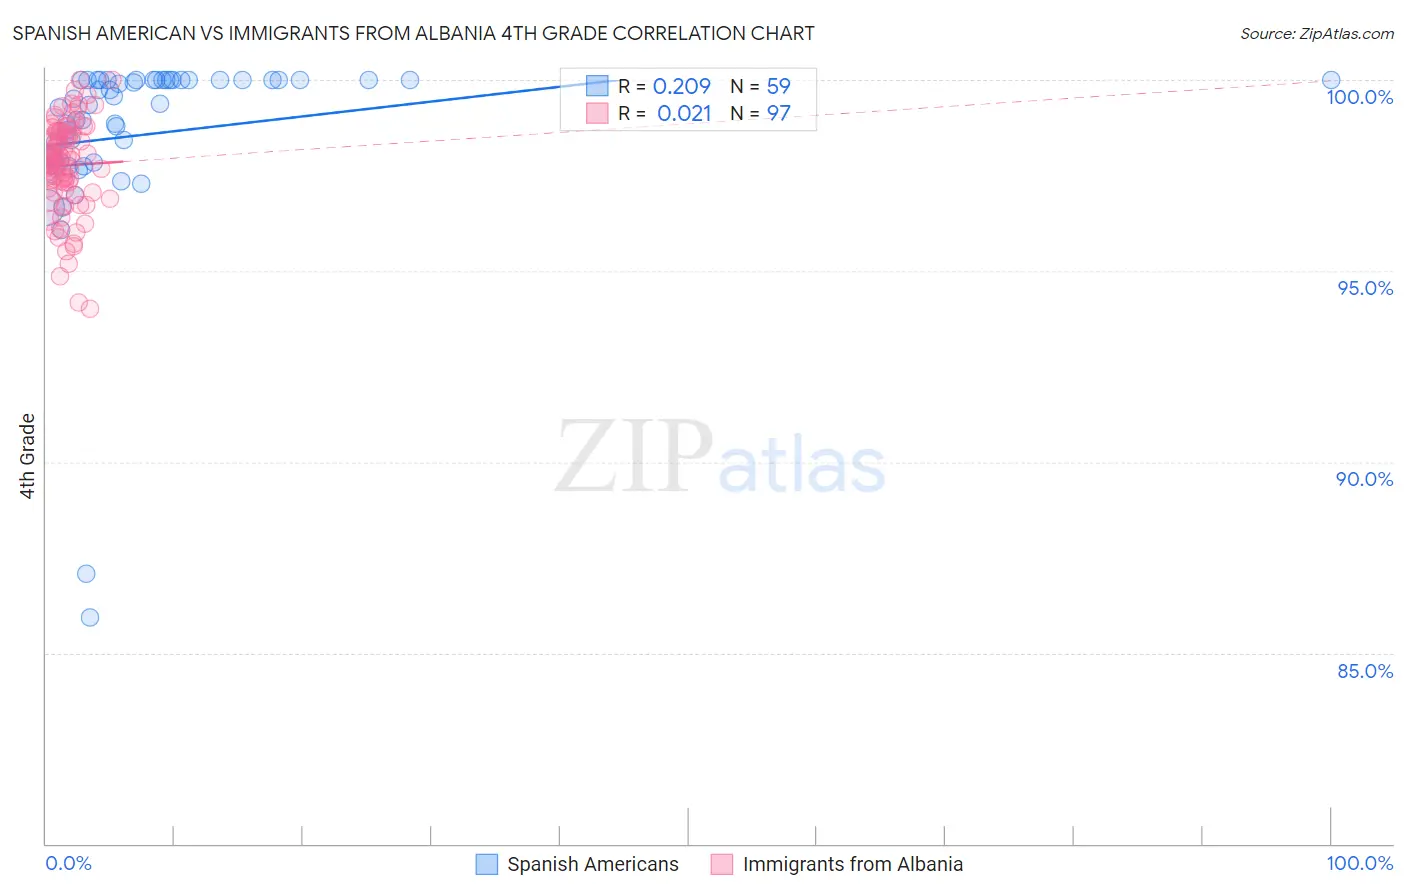
Spanish American vs Immigrants from Albania 4th Grade Correlation Chart
The statistical analysis conducted on geographies consisting of 103,168,542 people shows a weak positive correlation between the proportion of Spanish Americans and percentage of population with at least 4th grade education in the United States with a correlation coefficient (R) of 0.209 and weighted average of 97.5%. Similarly, the statistical analysis conducted on geographies consisting of 119,265,453 people shows no correlation between the proportion of Immigrants from Albania and percentage of population with at least 4th grade education in the United States with a correlation coefficient (R) of 0.021 and weighted average of 97.4%, a difference of 0.050%.
4th Grade Correlation Summary
| Measurement | Spanish American | Immigrants from Albania |
| Minimum | 85.9% | 94.0% |
| Maximum | 100.0% | 100.0% |
| Range | 14.1% | 6.0% |
| Mean | 98.6% | 97.8% |
| Median | 99.3% | 97.9% |
| Interquartile 25% (IQ1) | 97.9% | 97.1% |
| Interquartile 75% (IQ3) | 100.0% | 98.6% |
| Interquartile Range (IQR) | 2.1% | 1.5% |
| Standard Deviation (Sample) | 2.5% | 1.2% |
| Standard Deviation (Population) | 2.5% | 1.2% |
Demographics Similar to Spanish Americans and Immigrants from Albania by 4th Grade
In terms of 4th grade, the demographic groups most similar to Spanish Americans are Argentinean (97.5%, a difference of 0.0%), Immigrants from Venezuela (97.5%, a difference of 0.010%), Immigrants from Taiwan (97.5%, a difference of 0.010%), Pakistani (97.5%, a difference of 0.010%), and Immigrants from Kenya (97.5%, a difference of 0.010%). Similarly, the demographic groups most similar to Immigrants from Albania are Navajo (97.4%, a difference of 0.010%), Immigrants from Ukraine (97.4%, a difference of 0.010%), Immigrants from Egypt (97.4%, a difference of 0.010%), Portuguese (97.4%, a difference of 0.010%), and Paraguayan (97.4%, a difference of 0.010%).
| Demographics | Rating | Rank | 4th Grade |
| Immigrants | Kazakhstan | 43.6 /100 | #179 | Average 97.5% |
| Immigrants | Venezuela | 42.7 /100 | #180 | Average 97.5% |
| Immigrants | Taiwan | 41.5 /100 | #181 | Average 97.5% |
| Spanish Americans | 39.3 /100 | #182 | Fair 97.5% |
| Argentineans | 39.0 /100 | #183 | Fair 97.5% |
| Pakistanis | 36.2 /100 | #184 | Fair 97.5% |
| Immigrants | Kenya | 35.8 /100 | #185 | Fair 97.5% |
| Dutch West Indians | 35.8 /100 | #186 | Fair 97.5% |
| Mongolians | 34.7 /100 | #187 | Fair 97.5% |
| Immigrants | Argentina | 34.6 /100 | #188 | Fair 97.5% |
| Panamanians | 31.9 /100 | #189 | Fair 97.4% |
| Blacks/African Americans | 31.1 /100 | #190 | Fair 97.4% |
| Navajo | 30.7 /100 | #191 | Fair 97.4% |
| Immigrants | Ukraine | 30.1 /100 | #192 | Fair 97.4% |
| Immigrants | Egypt | 30.1 /100 | #193 | Fair 97.4% |
| Portuguese | 29.2 /100 | #194 | Fair 97.4% |
| Paraguayans | 28.9 /100 | #195 | Fair 97.4% |
| Immigrants | Albania | 27.7 /100 | #196 | Fair 97.4% |
| Hawaiians | 25.6 /100 | #197 | Fair 97.4% |
| Guamanians/Chamorros | 23.0 /100 | #198 | Fair 97.4% |
| Natives/Alaskans | 20.6 /100 | #199 | Fair 97.4% |