Immigrants from Ireland vs Filipino Currently Married
COMPARE
Immigrants from Ireland
Filipino
Currently Married
Currently Married Comparison
Immigrants from Ireland
Filipinos
48.4%
CURRENTLY MARRIED
98.5/ 100
METRIC RATING
59th/ 347
METRIC RANK
49.7%
CURRENTLY MARRIED
99.9/ 100
METRIC RATING
10th/ 347
METRIC RANK
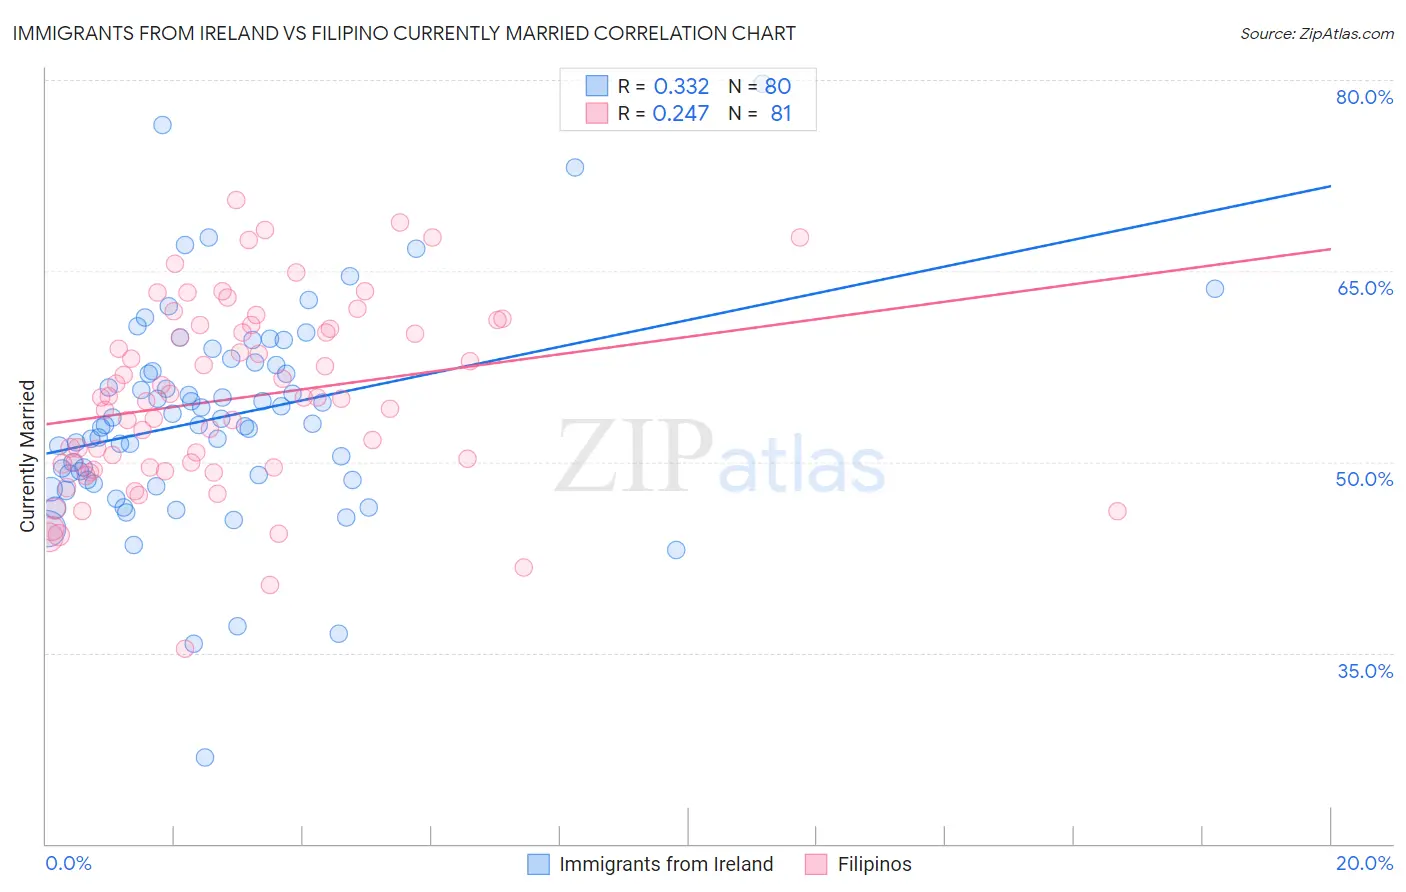
Immigrants from Ireland vs Filipino Currently Married Correlation Chart
The statistical analysis conducted on geographies consisting of 240,768,579 people shows a mild positive correlation between the proportion of Immigrants from Ireland and percentage of population currently married in the United States with a correlation coefficient (R) of 0.332 and weighted average of 48.4%. Similarly, the statistical analysis conducted on geographies consisting of 254,318,851 people shows a weak positive correlation between the proportion of Filipinos and percentage of population currently married in the United States with a correlation coefficient (R) of 0.247 and weighted average of 49.7%, a difference of 2.7%.
Currently Married Correlation Summary
| Measurement | Immigrants from Ireland | Filipino |
| Minimum | 26.8% | 35.4% |
| Maximum | 79.7% | 70.6% |
| Range | 52.9% | 35.2% |
| Mean | 53.5% | 55.0% |
| Median | 53.0% | 55.0% |
| Interquartile 25% (IQ1) | 48.6% | 49.6% |
| Interquartile 75% (IQ3) | 57.7% | 60.6% |
| Interquartile Range (IQR) | 9.1% | 11.0% |
| Standard Deviation (Sample) | 8.4% | 7.3% |
| Standard Deviation (Population) | 8.4% | 7.2% |
Similar Demographics by Currently Married
Demographics Similar to Immigrants from Ireland by Currently Married
In terms of currently married, the demographic groups most similar to Immigrants from Ireland are Immigrants from Romania (48.4%, a difference of 0.010%), French (48.4%, a difference of 0.030%), Romanian (48.4%, a difference of 0.030%), Asian (48.4%, a difference of 0.030%), and Immigrants from Netherlands (48.5%, a difference of 0.070%).
| Demographics | Rating | Rank | Currently Married |
| Russians | 98.9 /100 | #52 | Exceptional 48.6% |
| Immigrants | Austria | 98.8 /100 | #53 | Exceptional 48.5% |
| Immigrants | Moldova | 98.7 /100 | #54 | Exceptional 48.5% |
| Immigrants | North Macedonia | 98.7 /100 | #55 | Exceptional 48.5% |
| Latvians | 98.7 /100 | #56 | Exceptional 48.5% |
| Immigrants | Netherlands | 98.6 /100 | #57 | Exceptional 48.5% |
| French | 98.6 /100 | #58 | Exceptional 48.4% |
| Immigrants | Ireland | 98.5 /100 | #59 | Exceptional 48.4% |
| Immigrants | Romania | 98.5 /100 | #60 | Exceptional 48.4% |
| Romanians | 98.5 /100 | #61 | Exceptional 48.4% |
| Asians | 98.5 /100 | #62 | Exceptional 48.4% |
| Slavs | 98.3 /100 | #63 | Exceptional 48.4% |
| Immigrants | Czechoslovakia | 98.3 /100 | #64 | Exceptional 48.4% |
| Ukrainians | 98.3 /100 | #65 | Exceptional 48.4% |
| Tongans | 98.2 /100 | #66 | Exceptional 48.3% |
Demographics Similar to Filipinos by Currently Married
In terms of currently married, the demographic groups most similar to Filipinos are English (49.7%, a difference of 0.010%), Swiss (49.7%, a difference of 0.020%), Czech (49.9%, a difference of 0.26%), Dutch (49.6%, a difference of 0.28%), and German (49.6%, a difference of 0.29%).
| Demographics | Rating | Rank | Currently Married |
| Assyrians/Chaldeans/Syriacs | 100.0 /100 | #3 | Exceptional 50.8% |
| Immigrants | Taiwan | 100.0 /100 | #4 | Exceptional 50.7% |
| Danes | 100.0 /100 | #5 | Exceptional 50.5% |
| Norwegians | 100.0 /100 | #6 | Exceptional 50.2% |
| Immigrants | South Central Asia | 100.0 /100 | #7 | Exceptional 50.0% |
| Swedes | 100.0 /100 | #8 | Exceptional 50.0% |
| Czechs | 99.9 /100 | #9 | Exceptional 49.9% |
| Filipinos | 99.9 /100 | #10 | Exceptional 49.7% |
| English | 99.9 /100 | #11 | Exceptional 49.7% |
| Swiss | 99.9 /100 | #12 | Exceptional 49.7% |
| Dutch | 99.9 /100 | #13 | Exceptional 49.6% |
| Germans | 99.9 /100 | #14 | Exceptional 49.6% |
| Pennsylvania Germans | 99.9 /100 | #15 | Exceptional 49.6% |
| Chinese | 99.9 /100 | #16 | Exceptional 49.5% |
| Scandinavians | 99.9 /100 | #17 | Exceptional 49.5% |