Spanish American Indian vs Immigrants from Oceania Master's Degree
COMPARE
Spanish American Indian
Immigrants from Oceania
Master's Degree
Master's Degree Comparison
Spanish American Indians
Immigrants from Oceania
9.6%
MASTER'S DEGREE
0.0/ 100
METRIC RATING
339th/ 347
METRIC RANK
14.7%
MASTER'S DEGREE
37.1/ 100
METRIC RATING
186th/ 347
METRIC RANK
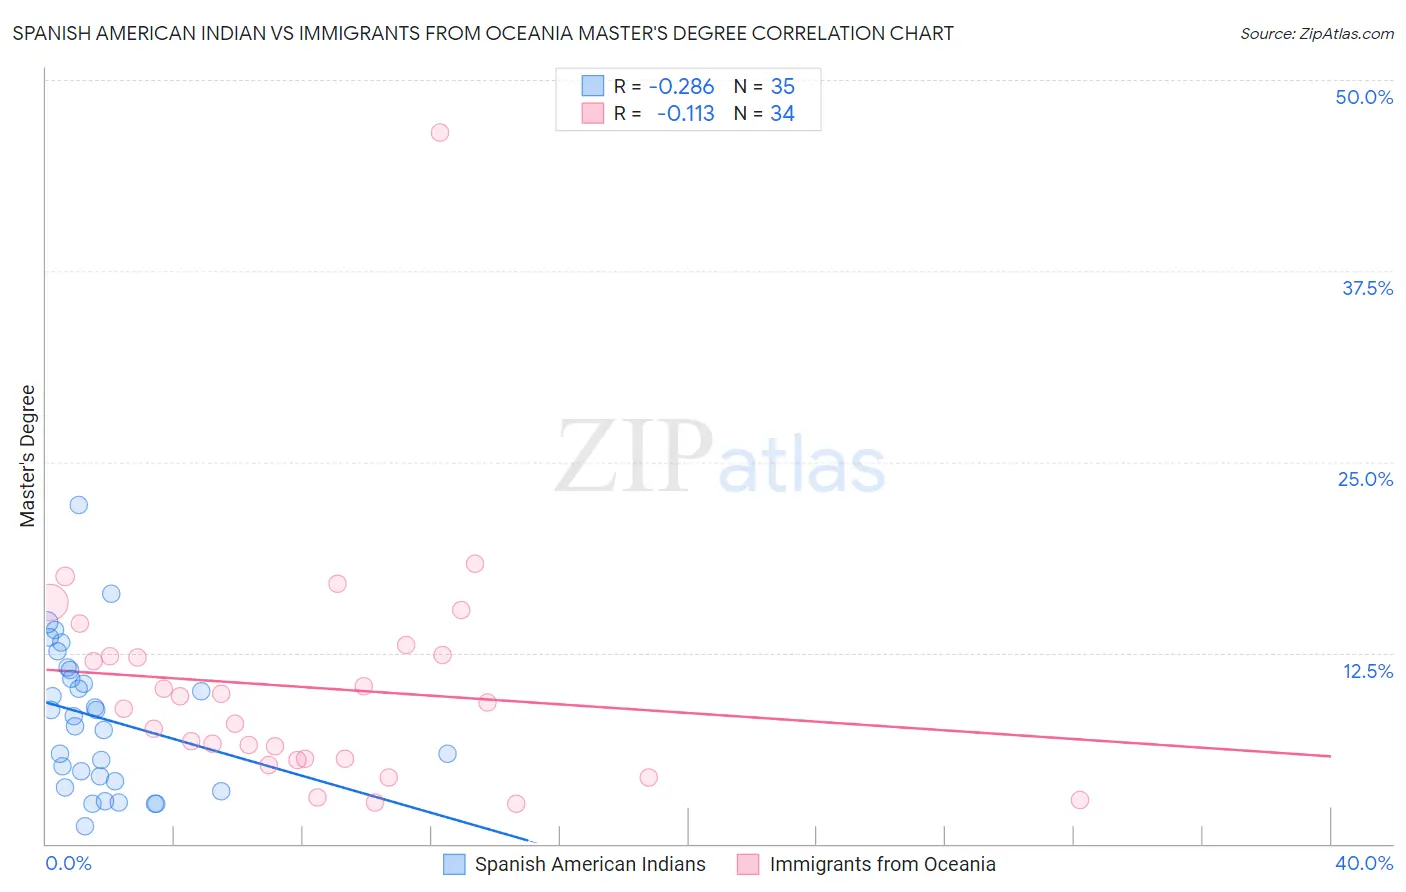
Spanish American Indian vs Immigrants from Oceania Master's Degree Correlation Chart
The statistical analysis conducted on geographies consisting of 73,142,188 people shows a weak negative correlation between the proportion of Spanish American Indians and percentage of population with at least master's degree education in the United States with a correlation coefficient (R) of -0.286 and weighted average of 9.6%. Similarly, the statistical analysis conducted on geographies consisting of 305,448,765 people shows a poor negative correlation between the proportion of Immigrants from Oceania and percentage of population with at least master's degree education in the United States with a correlation coefficient (R) of -0.113 and weighted average of 14.7%, a difference of 53.1%.
Master's Degree Correlation Summary
| Measurement | Spanish American Indian | Immigrants from Oceania |
| Minimum | 1.2% | 2.6% |
| Maximum | 22.2% | 46.6% |
| Range | 21.0% | 44.0% |
| Mean | 8.2% | 10.2% |
| Median | 8.4% | 9.0% |
| Interquartile 25% (IQ1) | 4.1% | 5.6% |
| Interquartile 75% (IQ3) | 11.4% | 12.3% |
| Interquartile Range (IQR) | 7.3% | 6.8% |
| Standard Deviation (Sample) | 4.8% | 7.9% |
| Standard Deviation (Population) | 4.7% | 7.7% |
Similar Demographics by Master's Degree
Demographics Similar to Spanish American Indians by Master's Degree
In terms of master's degree, the demographic groups most similar to Spanish American Indians are Yakama (9.5%, a difference of 1.2%), Tohono O'odham (9.7%, a difference of 1.3%), Mexican (9.7%, a difference of 1.4%), Navajo (9.4%, a difference of 1.6%), and Immigrants from Mexico (9.3%, a difference of 2.9%).
| Demographics | Rating | Rank | Master's Degree |
| Immigrants | Azores | 0.0 /100 | #332 | Tragic 10.2% |
| Menominee | 0.0 /100 | #333 | Tragic 10.2% |
| Arapaho | 0.0 /100 | #334 | Tragic 10.0% |
| Immigrants | Central America | 0.0 /100 | #335 | Tragic 10.0% |
| Natives/Alaskans | 0.0 /100 | #336 | Tragic 9.9% |
| Mexicans | 0.0 /100 | #337 | Tragic 9.7% |
| Tohono O'odham | 0.0 /100 | #338 | Tragic 9.7% |
| Spanish American Indians | 0.0 /100 | #339 | Tragic 9.6% |
| Yakama | 0.0 /100 | #340 | Tragic 9.5% |
| Navajo | 0.0 /100 | #341 | Tragic 9.4% |
| Immigrants | Mexico | 0.0 /100 | #342 | Tragic 9.3% |
| Lumbee | 0.0 /100 | #343 | Tragic 9.3% |
| Pima | 0.0 /100 | #344 | Tragic 9.2% |
| Yuman | 0.0 /100 | #345 | Tragic 9.2% |
| Yup'ik | 0.0 /100 | #346 | Tragic 8.5% |
Demographics Similar to Immigrants from Oceania by Master's Degree
In terms of master's degree, the demographic groups most similar to Immigrants from Oceania are Basque (14.7%, a difference of 0.080%), Immigrants from Costa Rica (14.7%, a difference of 0.12%), Barbadian (14.7%, a difference of 0.16%), Immigrants (14.6%, a difference of 0.16%), and Spaniard (14.6%, a difference of 0.19%).
| Demographics | Rating | Rank | Master's Degree |
| Immigrants | Iraq | 41.3 /100 | #179 | Average 14.8% |
| Celtics | 41.3 /100 | #180 | Average 14.8% |
| Swiss | 41.1 /100 | #181 | Average 14.7% |
| Czechs | 40.4 /100 | #182 | Average 14.7% |
| Sri Lankans | 39.6 /100 | #183 | Fair 14.7% |
| Immigrants | Zaire | 39.5 /100 | #184 | Fair 14.7% |
| Barbadians | 38.3 /100 | #185 | Fair 14.7% |
| Immigrants | Oceania | 37.1 /100 | #186 | Fair 14.7% |
| Basques | 36.5 /100 | #187 | Fair 14.7% |
| Immigrants | Costa Rica | 36.2 /100 | #188 | Fair 14.7% |
| Immigrants | Immigrants | 36.0 /100 | #189 | Fair 14.6% |
| Spaniards | 35.8 /100 | #190 | Fair 14.6% |
| Welsh | 34.2 /100 | #191 | Fair 14.6% |
| Immigrants | Middle Africa | 33.6 /100 | #192 | Fair 14.6% |
| Immigrants | Nigeria | 32.7 /100 | #193 | Fair 14.6% |