Spanish American Indian vs Turkish Average Family Size
COMPARE
Spanish American Indian
Turkish
Average Family Size
Average Family Size Comparison
Spanish American Indians
Turks
3.58
AVERAGE FAMILY SIZE
100.0/ 100
METRIC RATING
10th/ 347
METRIC RANK
3.16
AVERAGE FAMILY SIZE
1.3/ 100
METRIC RATING
258th/ 347
METRIC RANK
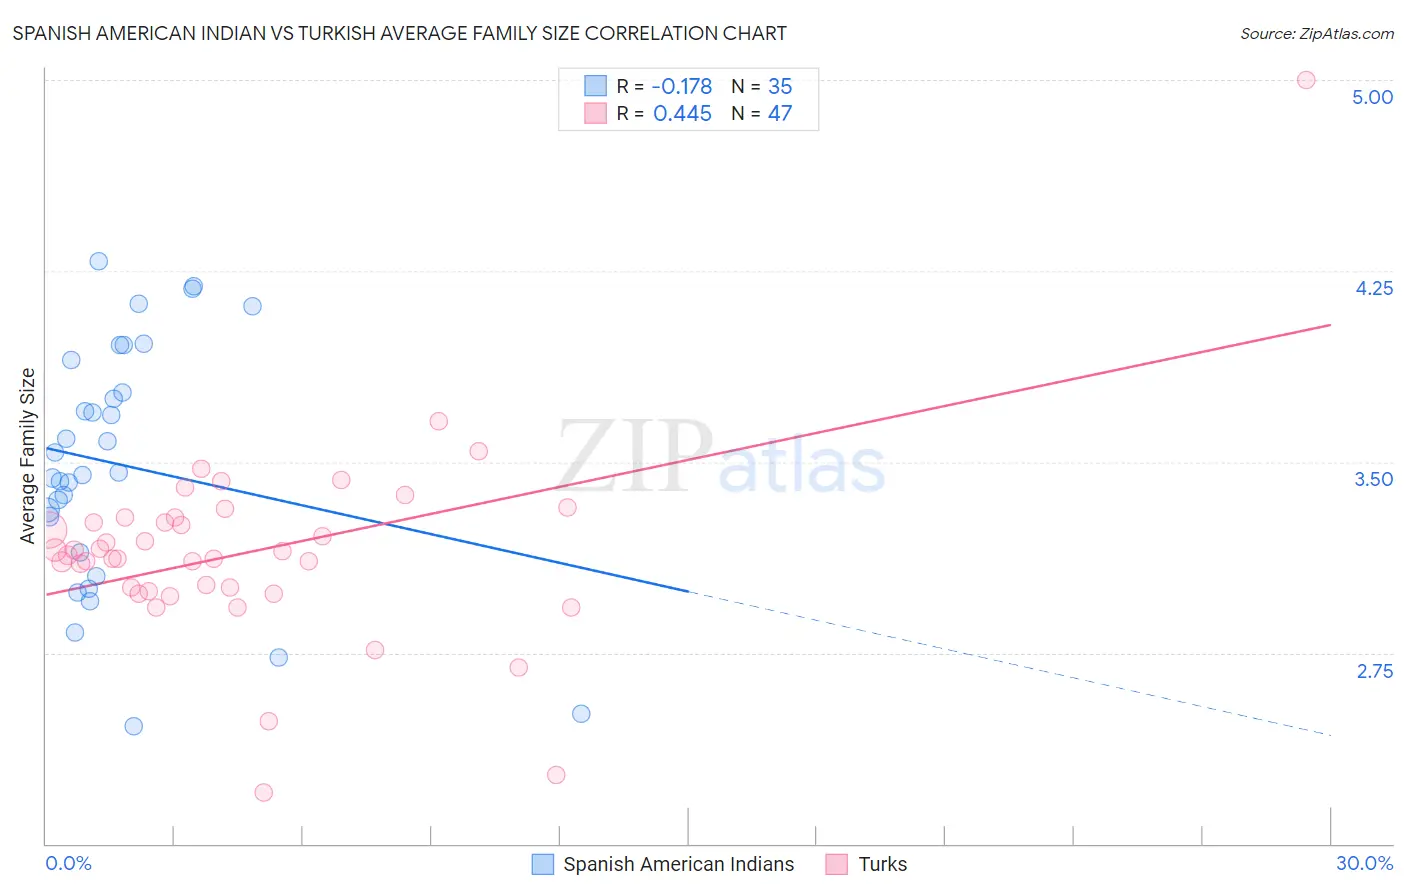
Spanish American Indian vs Turkish Average Family Size Correlation Chart
The statistical analysis conducted on geographies consisting of 73,145,550 people shows a poor negative correlation between the proportion of Spanish American Indians and average family size in the United States with a correlation coefficient (R) of -0.178 and weighted average of 3.58. Similarly, the statistical analysis conducted on geographies consisting of 271,710,663 people shows a moderate positive correlation between the proportion of Turks and average family size in the United States with a correlation coefficient (R) of 0.445 and weighted average of 3.16, a difference of 13.2%.
Average Family Size Correlation Summary
| Measurement | Spanish American Indian | Turkish |
| Minimum | 2.46 | 2.20 |
| Maximum | 4.29 | 5.00 |
| Range | 1.83 | 2.80 |
| Mean | 3.49 | 3.15 |
| Median | 3.46 | 3.13 |
| Interquartile 25% (IQ1) | 3.15 | 2.99 |
| Interquartile 75% (IQ3) | 3.90 | 3.28 |
| Interquartile Range (IQR) | 0.75 | 0.29 |
| Standard Deviation (Sample) | 0.48 | 0.39 |
| Standard Deviation (Population) | 0.47 | 0.39 |
Similar Demographics by Average Family Size
Demographics Similar to Spanish American Indians by Average Family Size
In terms of average family size, the demographic groups most similar to Spanish American Indians are Hopi (3.60, a difference of 0.35%), Immigrants from Yemen (3.60, a difference of 0.36%), Inupiat (3.63, a difference of 1.2%), Arapaho (3.64, a difference of 1.4%), and Tohono O'odham (3.53, a difference of 1.4%).
| Demographics | Rating | Rank | Average Family Size |
| Pueblo | 100 /100 | #3 | Exceptional 3.79 |
| Pima | 100 /100 | #4 | Exceptional 3.75 |
| Navajo | 100.0 /100 | #5 | Exceptional 3.65 |
| Arapaho | 100.0 /100 | #6 | Exceptional 3.64 |
| Inupiat | 100.0 /100 | #7 | Exceptional 3.63 |
| Immigrants | Yemen | 100.0 /100 | #8 | Exceptional 3.60 |
| Hopi | 100.0 /100 | #9 | Exceptional 3.60 |
| Spanish American Indians | 100.0 /100 | #10 | Exceptional 3.58 |
| Tohono O'odham | 100.0 /100 | #11 | Exceptional 3.53 |
| Immigrants | Mexico | 100.0 /100 | #12 | Exceptional 3.52 |
| Sioux | 100.0 /100 | #13 | Exceptional 3.52 |
| Immigrants | Central America | 100.0 /100 | #14 | Exceptional 3.49 |
| Tongans | 100.0 /100 | #15 | Exceptional 3.49 |
| Ute | 100.0 /100 | #16 | Exceptional 3.49 |
| Immigrants | El Salvador | 100.0 /100 | #17 | Exceptional 3.49 |
Demographics Similar to Turks by Average Family Size
In terms of average family size, the demographic groups most similar to Turks are Potawatomi (3.16, a difference of 0.0%), Immigrants from Albania (3.16, a difference of 0.010%), Immigrants from North Macedonia (3.16, a difference of 0.010%), Immigrants from Russia (3.16, a difference of 0.020%), and Albanian (3.17, a difference of 0.050%).
| Demographics | Rating | Rank | Average Family Size |
| Immigrants | Spain | 1.8 /100 | #251 | Tragic 3.17 |
| Immigrants | Saudi Arabia | 1.7 /100 | #252 | Tragic 3.17 |
| South Africans | 1.7 /100 | #253 | Tragic 3.17 |
| Immigrants | Hungary | 1.7 /100 | #254 | Tragic 3.17 |
| Cape Verdeans | 1.6 /100 | #255 | Tragic 3.17 |
| Immigrants | Kazakhstan | 1.5 /100 | #256 | Tragic 3.17 |
| Albanians | 1.5 /100 | #257 | Tragic 3.17 |
| Turks | 1.3 /100 | #258 | Tragic 3.16 |
| Potawatomi | 1.3 /100 | #259 | Tragic 3.16 |
| Immigrants | Albania | 1.3 /100 | #260 | Tragic 3.16 |
| Immigrants | North Macedonia | 1.3 /100 | #261 | Tragic 3.16 |
| Immigrants | Russia | 1.3 /100 | #262 | Tragic 3.16 |
| Immigrants | Bulgaria | 1.0 /100 | #263 | Tragic 3.16 |
| Americans | 1.0 /100 | #264 | Tragic 3.16 |
| Immigrants | South Africa | 0.9 /100 | #265 | Tragic 3.16 |