South American vs Immigrants from Canada Householder Income Under 25 years
COMPARE
South American
Immigrants from Canada
Householder Income Under 25 years
Householder Income Under 25 years Comparison
South Americans
Immigrants from Canada
$53,939
HOUSEHOLDER INCOME UNDER 25 YEARS
98.6/ 100
METRIC RATING
101st/ 347
METRIC RANK
$53,411
HOUSEHOLDER INCOME UNDER 25 YEARS
95.2/ 100
METRIC RATING
121st/ 347
METRIC RANK
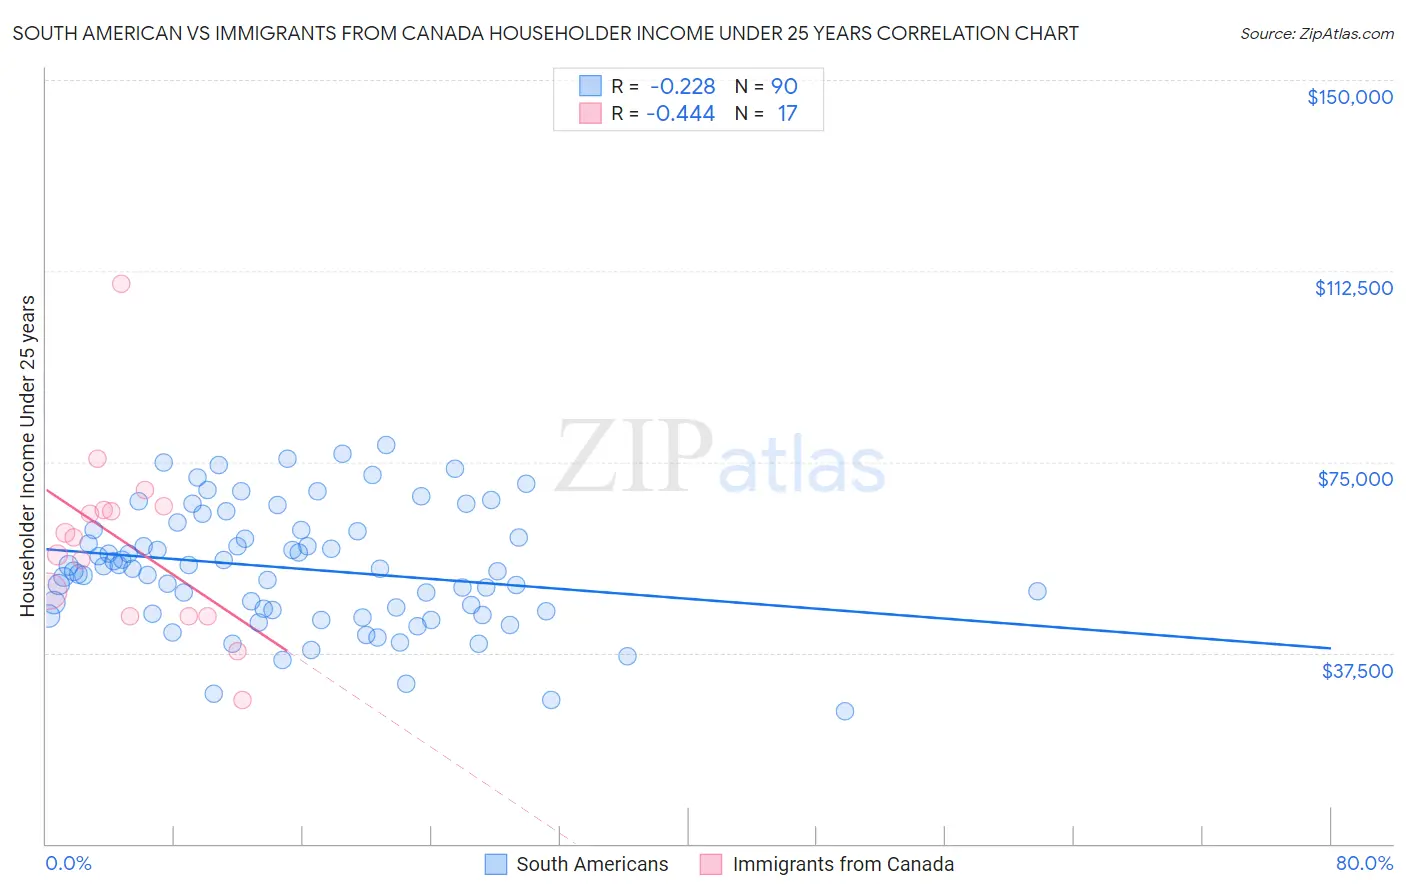
South American vs Immigrants from Canada Householder Income Under 25 years Correlation Chart
The statistical analysis conducted on geographies consisting of 401,700,019 people shows a weak negative correlation between the proportion of South Americans and household income with householder under the age of 25 in the United States with a correlation coefficient (R) of -0.228 and weighted average of $53,939. Similarly, the statistical analysis conducted on geographies consisting of 375,368,840 people shows a moderate negative correlation between the proportion of Immigrants from Canada and household income with householder under the age of 25 in the United States with a correlation coefficient (R) of -0.444 and weighted average of $53,411, a difference of 0.99%.
Householder Income Under 25 years Correlation Summary
| Measurement | South American | Immigrants from Canada |
| Minimum | $26,011 | $28,317 |
| Maximum | $78,265 | $109,961 |
| Range | $52,254 | $81,644 |
| Mean | $54,082 | $58,863 |
| Median | $53,957 | $60,245 |
| Interquartile 25% (IQ1) | $45,625 | $44,733 |
| Interquartile 75% (IQ3) | $61,659 | $65,961 |
| Interquartile Range (IQR) | $16,034 | $21,228 |
| Standard Deviation (Sample) | $11,713 | $18,135 |
| Standard Deviation (Population) | $11,648 | $17,594 |
Demographics Similar to South Americans and Immigrants from Canada by Householder Income Under 25 years
In terms of householder income under 25 years, the demographic groups most similar to South Americans are Ecuadorian ($53,911, a difference of 0.050%), Ukrainian ($53,843, a difference of 0.18%), Ethiopian ($53,818, a difference of 0.22%), Immigrants from France ($53,805, a difference of 0.25%), and Albanian ($53,794, a difference of 0.27%). Similarly, the demographic groups most similar to Immigrants from Canada are Guamanian/Chamorro ($53,423, a difference of 0.020%), Italian ($53,426, a difference of 0.030%), Immigrants from Switzerland ($53,528, a difference of 0.22%), Lithuanian ($53,552, a difference of 0.26%), and Immigrants from Spain ($53,560, a difference of 0.28%).
| Demographics | Rating | Rank | Householder Income Under 25 years |
| South Americans | 98.6 /100 | #101 | Exceptional $53,939 |
| Ecuadorians | 98.5 /100 | #102 | Exceptional $53,911 |
| Ukrainians | 98.3 /100 | #103 | Exceptional $53,843 |
| Ethiopians | 98.2 /100 | #104 | Exceptional $53,818 |
| Immigrants | France | 98.1 /100 | #105 | Exceptional $53,805 |
| Albanians | 98.1 /100 | #106 | Exceptional $53,794 |
| Australians | 97.8 /100 | #107 | Exceptional $53,739 |
| Maltese | 97.8 /100 | #108 | Exceptional $53,735 |
| Immigrants | Ecuador | 97.7 /100 | #109 | Exceptional $53,722 |
| Greeks | 97.7 /100 | #110 | Exceptional $53,715 |
| Immigrants | Colombia | 97.7 /100 | #111 | Exceptional $53,714 |
| Immigrants | Oceania | 97.5 /100 | #112 | Exceptional $53,680 |
| Romanians | 97.2 /100 | #113 | Exceptional $53,632 |
| Immigrants | Sweden | 97.1 /100 | #114 | Exceptional $53,621 |
| Immigrants | Albania | 96.9 /100 | #115 | Exceptional $53,597 |
| Immigrants | Spain | 96.6 /100 | #116 | Exceptional $53,560 |
| Lithuanians | 96.6 /100 | #117 | Exceptional $53,552 |
| Immigrants | Switzerland | 96.3 /100 | #118 | Exceptional $53,528 |
| Italians | 95.4 /100 | #119 | Exceptional $53,426 |
| Guamanians/Chamorros | 95.3 /100 | #120 | Exceptional $53,423 |
| Immigrants | Canada | 95.2 /100 | #121 | Exceptional $53,411 |