South American vs Hispanic or Latino 2nd Grade
COMPARE
South American
Hispanic or Latino
2nd Grade
2nd Grade Comparison
South Americans
Hispanics or Latinos
97.5%
2ND GRADE
0.9/ 100
METRIC RATING
246th/ 347
METRIC RANK
96.8%
2ND GRADE
0.0/ 100
METRIC RATING
313th/ 347
METRIC RANK
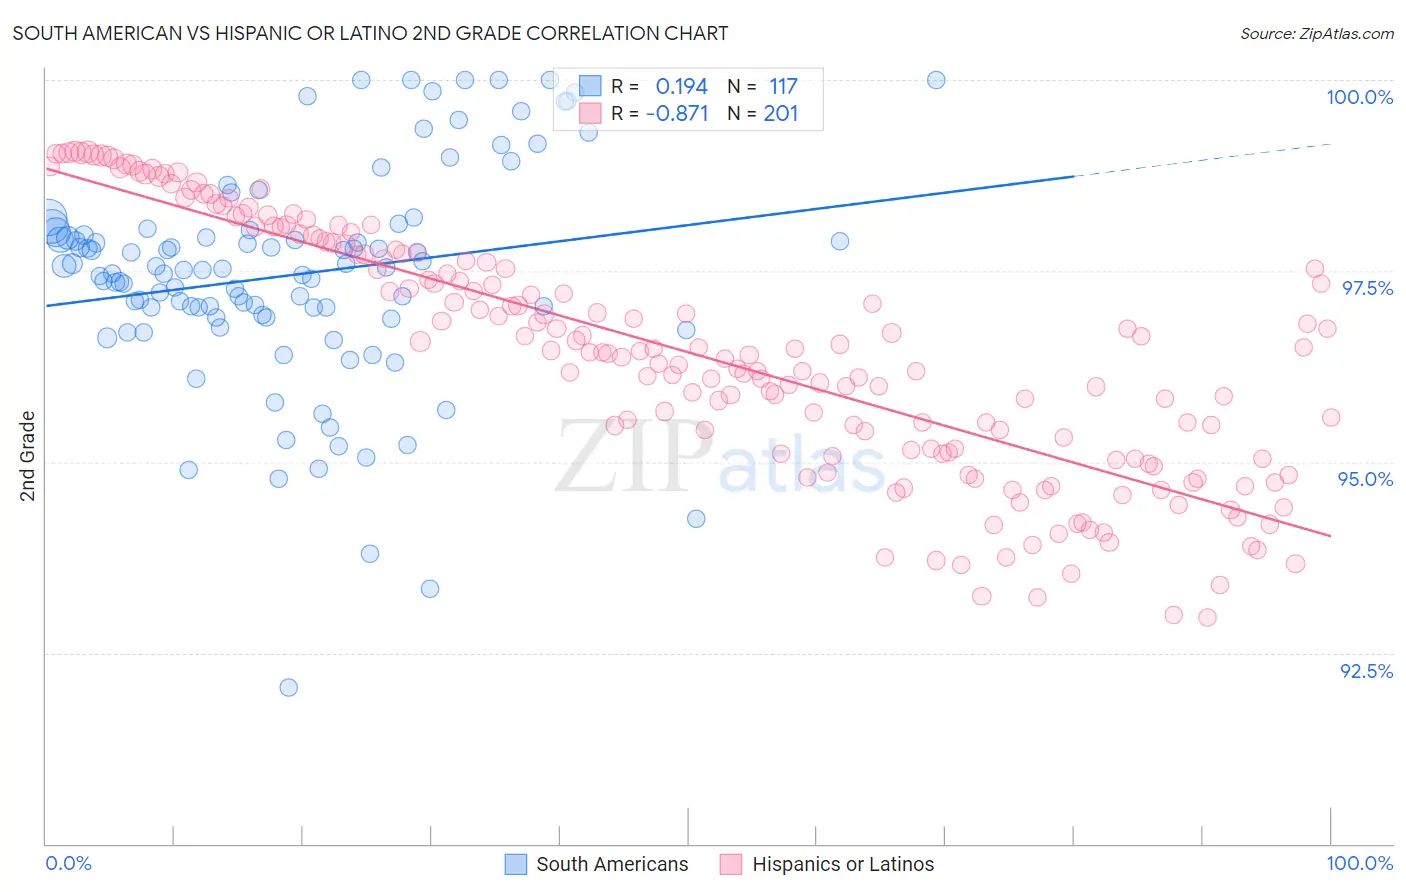
South American vs Hispanic or Latino 2nd Grade Correlation Chart
The statistical analysis conducted on geographies consisting of 494,178,447 people shows a poor positive correlation between the proportion of South Americans and percentage of population with at least 2nd grade education in the United States with a correlation coefficient (R) of 0.194 and weighted average of 97.5%. Similarly, the statistical analysis conducted on geographies consisting of 578,615,396 people shows a very strong negative correlation between the proportion of Hispanics or Latinos and percentage of population with at least 2nd grade education in the United States with a correlation coefficient (R) of -0.871 and weighted average of 96.8%, a difference of 0.73%.
2nd Grade Correlation Summary
| Measurement | South American | Hispanic or Latino |
| Minimum | 92.1% | 93.0% |
| Maximum | 100.0% | 99.1% |
| Range | 7.9% | 6.1% |
| Mean | 97.5% | 96.4% |
| Median | 97.5% | 96.4% |
| Interquartile 25% (IQ1) | 96.9% | 95.1% |
| Interquartile 75% (IQ3) | 98.0% | 97.8% |
| Interquartile Range (IQR) | 1.1% | 2.6% |
| Standard Deviation (Sample) | 1.4% | 1.6% |
| Standard Deviation (Population) | 1.4% | 1.6% |
Similar Demographics by 2nd Grade
Demographics Similar to South Americans by 2nd Grade
In terms of 2nd grade, the demographic groups most similar to South Americans are Immigrants from Eastern Africa (97.5%, a difference of 0.0%), Immigrants from Senegal (97.5%, a difference of 0.0%), Immigrants from Middle Africa (97.5%, a difference of 0.0%), Bolivian (97.5%, a difference of 0.0%), and Immigrants from Iraq (97.5%, a difference of 0.010%).
| Demographics | Rating | Rank | 2nd Grade |
| Liberians | 1.6 /100 | #239 | Tragic 97.6% |
| Koreans | 1.5 /100 | #240 | Tragic 97.5% |
| Ethiopians | 1.2 /100 | #241 | Tragic 97.5% |
| Immigrants | Indonesia | 1.2 /100 | #242 | Tragic 97.5% |
| Asians | 1.1 /100 | #243 | Tragic 97.5% |
| Immigrants | Iraq | 1.0 /100 | #244 | Tragic 97.5% |
| Immigrants | Eastern Africa | 0.9 /100 | #245 | Tragic 97.5% |
| South Americans | 0.9 /100 | #246 | Tragic 97.5% |
| Immigrants | Senegal | 0.9 /100 | #247 | Tragic 97.5% |
| Immigrants | Middle Africa | 0.9 /100 | #248 | Tragic 97.5% |
| Bolivians | 0.9 /100 | #249 | Tragic 97.5% |
| Peruvians | 0.9 /100 | #250 | Tragic 97.5% |
| Immigrants | Africa | 0.8 /100 | #251 | Tragic 97.5% |
| Immigrants | Asia | 0.7 /100 | #252 | Tragic 97.5% |
| Puerto Ricans | 0.7 /100 | #253 | Tragic 97.5% |
Demographics Similar to Hispanics or Latinos by 2nd Grade
In terms of 2nd grade, the demographic groups most similar to Hispanics or Latinos are Cape Verdean (96.8%, a difference of 0.020%), Sri Lankan (96.8%, a difference of 0.030%), Guyanese (96.8%, a difference of 0.030%), Immigrants from Ecuador (96.8%, a difference of 0.030%), and Immigrants from Haiti (96.8%, a difference of 0.040%).
| Demographics | Rating | Rank | 2nd Grade |
| Immigrants | Somalia | 0.0 /100 | #306 | Tragic 96.9% |
| Immigrants | Azores | 0.0 /100 | #307 | Tragic 96.8% |
| Immigrants | Haiti | 0.0 /100 | #308 | Tragic 96.8% |
| Belizeans | 0.0 /100 | #309 | Tragic 96.8% |
| Sri Lankans | 0.0 /100 | #310 | Tragic 96.8% |
| Guyanese | 0.0 /100 | #311 | Tragic 96.8% |
| Cape Verdeans | 0.0 /100 | #312 | Tragic 96.8% |
| Hispanics or Latinos | 0.0 /100 | #313 | Tragic 96.8% |
| Immigrants | Ecuador | 0.0 /100 | #314 | Tragic 96.8% |
| Immigrants | Belize | 0.0 /100 | #315 | Tragic 96.8% |
| Hondurans | 0.0 /100 | #316 | Tragic 96.7% |
| Immigrants | Laos | 0.0 /100 | #317 | Tragic 96.7% |
| Indonesians | 0.0 /100 | #318 | Tragic 96.7% |
| Immigrants | Nicaragua | 0.0 /100 | #319 | Tragic 96.7% |
| Immigrants | Guyana | 0.0 /100 | #320 | Tragic 96.7% |