South American vs Choctaw Family Households
COMPARE
South American
Choctaw
Family Households
Family Households Comparison
South Americans
Choctaw
66.0%
FAMILY HOUSEHOLDS
100.0/ 100
METRIC RATING
60th/ 347
METRIC RANK
64.9%
FAMILY HOUSEHOLDS
93.4/ 100
METRIC RATING
123rd/ 347
METRIC RANK
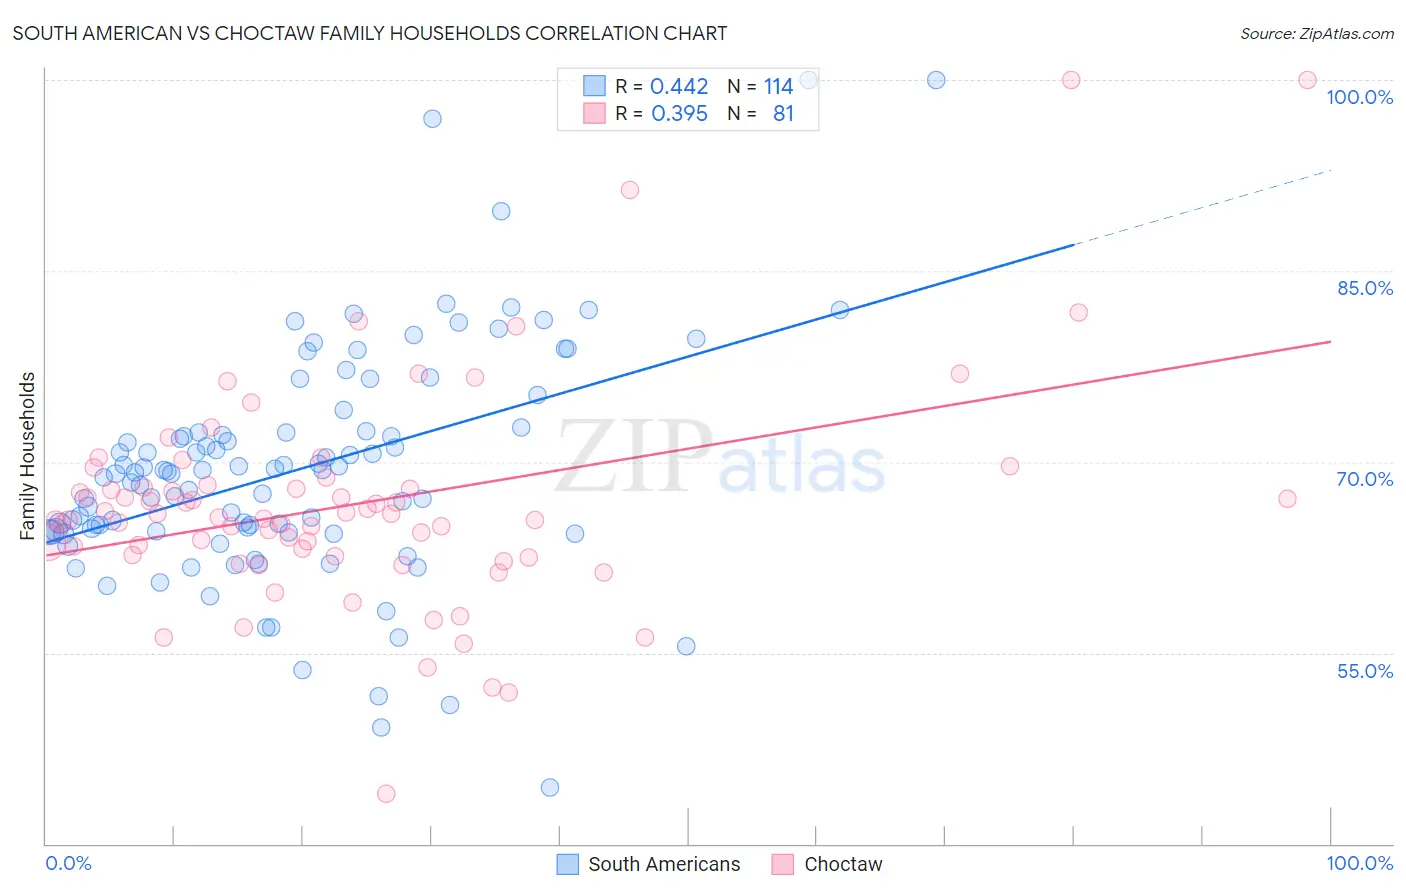
South American vs Choctaw Family Households Correlation Chart
The statistical analysis conducted on geographies consisting of 493,649,007 people shows a moderate positive correlation between the proportion of South Americans and percentage of family households in the United States with a correlation coefficient (R) of 0.442 and weighted average of 66.0%. Similarly, the statistical analysis conducted on geographies consisting of 269,627,638 people shows a mild positive correlation between the proportion of Choctaw and percentage of family households in the United States with a correlation coefficient (R) of 0.395 and weighted average of 64.9%, a difference of 1.8%.
Family Households Correlation Summary
| Measurement | South American | Choctaw |
| Minimum | 44.4% | 43.9% |
| Maximum | 100.0% | 100.0% |
| Range | 55.6% | 56.1% |
| Mean | 69.3% | 66.7% |
| Median | 69.1% | 65.7% |
| Interquartile 25% (IQ1) | 64.5% | 62.6% |
| Interquartile 75% (IQ3) | 72.3% | 68.1% |
| Interquartile Range (IQR) | 7.8% | 5.5% |
| Standard Deviation (Sample) | 9.1% | 8.8% |
| Standard Deviation (Population) | 9.1% | 8.7% |
Similar Demographics by Family Households
Demographics Similar to South Americans by Family Households
In terms of family households, the demographic groups most similar to South Americans are Immigrants from Korea (66.0%, a difference of 0.010%), Danish (66.0%, a difference of 0.020%), Immigrants from Asia (66.1%, a difference of 0.030%), Central American (66.0%, a difference of 0.050%), and Immigrants from Indonesia (66.0%, a difference of 0.090%).
| Demographics | Rating | Rank | Family Households |
| Afghans | 100.0 /100 | #53 | Exceptional 66.3% |
| Immigrants | Colombia | 100.0 /100 | #54 | Exceptional 66.3% |
| Immigrants | Immigrants | 100.0 /100 | #55 | Exceptional 66.1% |
| Immigrants | Hong Kong | 100.0 /100 | #56 | Exceptional 66.1% |
| Pennsylvania Germans | 100.0 /100 | #57 | Exceptional 66.1% |
| Immigrants | Asia | 100.0 /100 | #58 | Exceptional 66.1% |
| Immigrants | Korea | 100.0 /100 | #59 | Exceptional 66.0% |
| South Americans | 100.0 /100 | #60 | Exceptional 66.0% |
| Danes | 100.0 /100 | #61 | Exceptional 66.0% |
| Central Americans | 100.0 /100 | #62 | Exceptional 66.0% |
| Immigrants | Indonesia | 100.0 /100 | #63 | Exceptional 66.0% |
| Pima | 99.9 /100 | #64 | Exceptional 65.9% |
| Costa Ricans | 99.9 /100 | #65 | Exceptional 65.9% |
| Fijians | 99.9 /100 | #66 | Exceptional 65.9% |
| Filipinos | 99.9 /100 | #67 | Exceptional 65.9% |
Demographics Similar to Choctaw by Family Households
In terms of family households, the demographic groups most similar to Choctaw are Hmong (64.9%, a difference of 0.0%), Immigrants from Argentina (64.9%, a difference of 0.030%), Immigrants from Belize (64.9%, a difference of 0.030%), Hungarian (64.9%, a difference of 0.040%), and Immigrants from Oceania (64.9%, a difference of 0.050%).
| Demographics | Rating | Rank | Family Households |
| Immigrants | Iraq | 95.4 /100 | #116 | Exceptional 65.0% |
| Cherokee | 95.3 /100 | #117 | Exceptional 65.0% |
| Dutch | 95.1 /100 | #118 | Exceptional 64.9% |
| Immigrants | Eastern Asia | 94.4 /100 | #119 | Exceptional 64.9% |
| Immigrants | Oceania | 94.2 /100 | #120 | Exceptional 64.9% |
| Hungarians | 94.0 /100 | #121 | Exceptional 64.9% |
| Hmong | 93.4 /100 | #122 | Exceptional 64.9% |
| Choctaw | 93.4 /100 | #123 | Exceptional 64.9% |
| Immigrants | Argentina | 92.8 /100 | #124 | Exceptional 64.9% |
| Immigrants | Belize | 92.7 /100 | #125 | Exceptional 64.9% |
| Panamanians | 92.4 /100 | #126 | Exceptional 64.8% |
| Immigrants | Panama | 92.0 /100 | #127 | Exceptional 64.8% |
| Italians | 91.9 /100 | #128 | Exceptional 64.8% |
| Immigrants | Ecuador | 91.4 /100 | #129 | Exceptional 64.8% |
| Immigrants | Italy | 90.2 /100 | #130 | Exceptional 64.8% |