South American vs Immigrants from Dominican Republic Family Households
COMPARE
South American
Immigrants from Dominican Republic
Family Households
Family Households Comparison
South Americans
Immigrants from Dominican Republic
66.0%
FAMILY HOUSEHOLDS
100.0/ 100
METRIC RATING
60th/ 347
METRIC RANK
63.3%
FAMILY HOUSEHOLDS
1.0/ 100
METRIC RATING
253rd/ 347
METRIC RANK
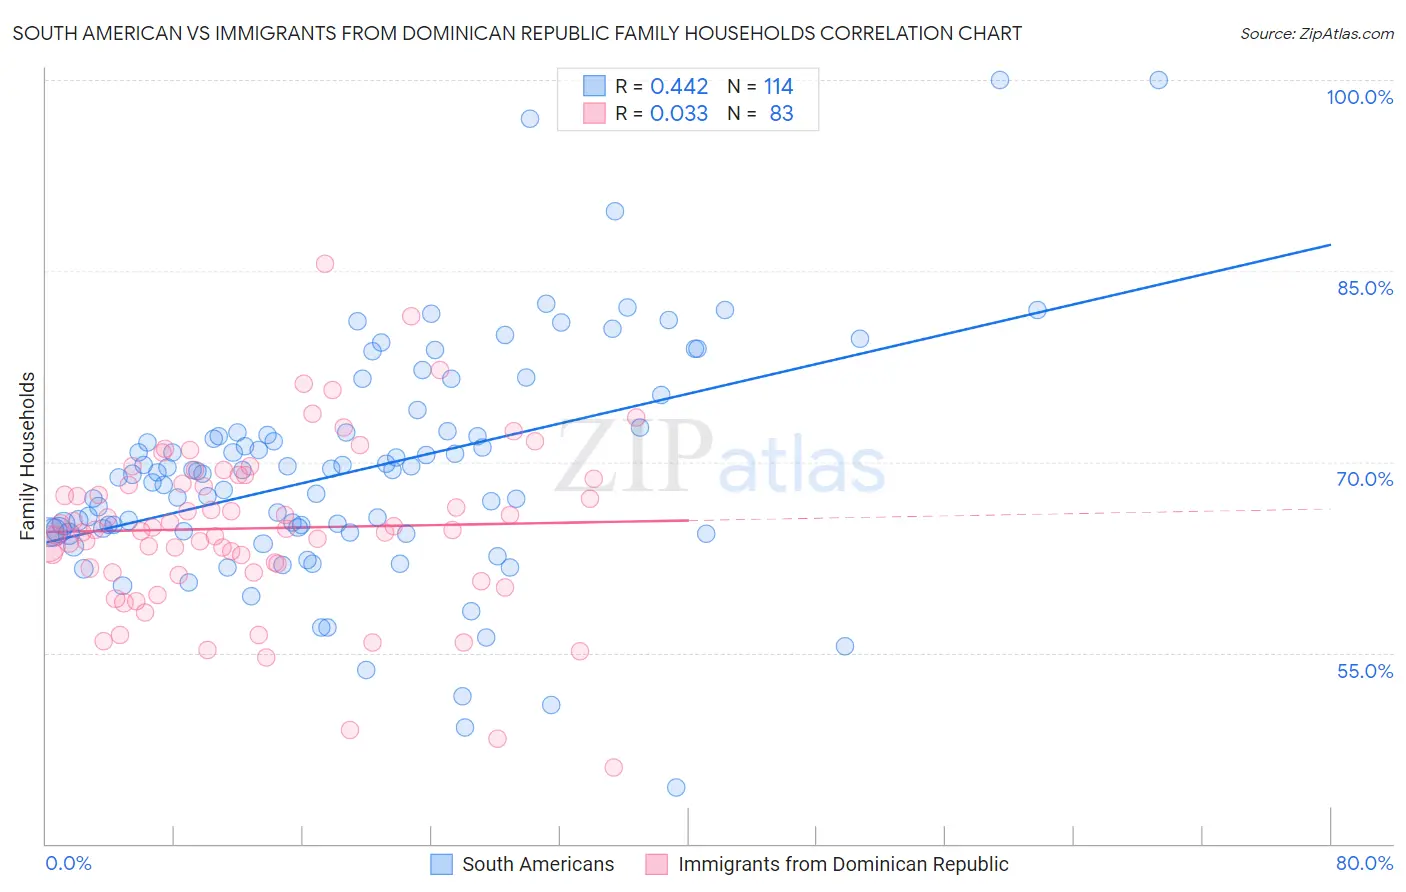
South American vs Immigrants from Dominican Republic Family Households Correlation Chart
The statistical analysis conducted on geographies consisting of 493,649,007 people shows a moderate positive correlation between the proportion of South Americans and percentage of family households in the United States with a correlation coefficient (R) of 0.442 and weighted average of 66.0%. Similarly, the statistical analysis conducted on geographies consisting of 274,978,425 people shows no correlation between the proportion of Immigrants from Dominican Republic and percentage of family households in the United States with a correlation coefficient (R) of 0.033 and weighted average of 63.3%, a difference of 4.3%.
Family Households Correlation Summary
| Measurement | South American | Immigrants from Dominican Republic |
| Minimum | 44.4% | 46.0% |
| Maximum | 100.0% | 85.5% |
| Range | 55.6% | 39.6% |
| Mean | 69.3% | 64.8% |
| Median | 69.1% | 64.7% |
| Interquartile 25% (IQ1) | 64.5% | 61.3% |
| Interquartile 75% (IQ3) | 72.3% | 68.7% |
| Interquartile Range (IQR) | 7.8% | 7.4% |
| Standard Deviation (Sample) | 9.1% | 6.7% |
| Standard Deviation (Population) | 9.1% | 6.6% |
Similar Demographics by Family Households
Demographics Similar to South Americans by Family Households
In terms of family households, the demographic groups most similar to South Americans are Immigrants from Korea (66.0%, a difference of 0.010%), Danish (66.0%, a difference of 0.020%), Immigrants from Asia (66.1%, a difference of 0.030%), Central American (66.0%, a difference of 0.050%), and Immigrants from Indonesia (66.0%, a difference of 0.090%).
| Demographics | Rating | Rank | Family Households |
| Afghans | 100.0 /100 | #53 | Exceptional 66.3% |
| Immigrants | Colombia | 100.0 /100 | #54 | Exceptional 66.3% |
| Immigrants | Immigrants | 100.0 /100 | #55 | Exceptional 66.1% |
| Immigrants | Hong Kong | 100.0 /100 | #56 | Exceptional 66.1% |
| Pennsylvania Germans | 100.0 /100 | #57 | Exceptional 66.1% |
| Immigrants | Asia | 100.0 /100 | #58 | Exceptional 66.1% |
| Immigrants | Korea | 100.0 /100 | #59 | Exceptional 66.0% |
| South Americans | 100.0 /100 | #60 | Exceptional 66.0% |
| Danes | 100.0 /100 | #61 | Exceptional 66.0% |
| Central Americans | 100.0 /100 | #62 | Exceptional 66.0% |
| Immigrants | Indonesia | 100.0 /100 | #63 | Exceptional 66.0% |
| Pima | 99.9 /100 | #64 | Exceptional 65.9% |
| Costa Ricans | 99.9 /100 | #65 | Exceptional 65.9% |
| Fijians | 99.9 /100 | #66 | Exceptional 65.9% |
| Filipinos | 99.9 /100 | #67 | Exceptional 65.9% |
Demographics Similar to Immigrants from Dominican Republic by Family Households
In terms of family households, the demographic groups most similar to Immigrants from Dominican Republic are Slovak (63.3%, a difference of 0.010%), Bahamian (63.3%, a difference of 0.020%), Potawatomi (63.3%, a difference of 0.030%), Taiwanese (63.3%, a difference of 0.040%), and Luxembourger (63.3%, a difference of 0.050%).
| Demographics | Rating | Rank | Family Households |
| Immigrants | Ghana | 1.6 /100 | #246 | Tragic 63.4% |
| Immigrants | Uzbekistan | 1.5 /100 | #247 | Tragic 63.4% |
| Dominicans | 1.5 /100 | #248 | Tragic 63.4% |
| Russians | 1.4 /100 | #249 | Tragic 63.4% |
| Immigrants | Japan | 1.4 /100 | #250 | Tragic 63.4% |
| Taiwanese | 1.2 /100 | #251 | Tragic 63.3% |
| Bahamians | 1.1 /100 | #252 | Tragic 63.3% |
| Immigrants | Dominican Republic | 1.0 /100 | #253 | Tragic 63.3% |
| Slovaks | 1.0 /100 | #254 | Tragic 63.3% |
| Potawatomi | 1.0 /100 | #255 | Tragic 63.3% |
| Luxembourgers | 0.9 /100 | #256 | Tragic 63.3% |
| Icelanders | 0.8 /100 | #257 | Tragic 63.3% |
| Immigrants | Barbados | 0.7 /100 | #258 | Tragic 63.2% |
| Immigrants | Western Europe | 0.6 /100 | #259 | Tragic 63.2% |
| Cypriots | 0.6 /100 | #260 | Tragic 63.2% |