Immigrants from Honduras vs Choctaw Family Households
COMPARE
Immigrants from Honduras
Choctaw
Family Households
Family Households Comparison
Immigrants from Honduras
Choctaw
64.2%
FAMILY HOUSEHOLDS
35.0/ 100
METRIC RATING
180th/ 347
METRIC RANK
64.9%
FAMILY HOUSEHOLDS
93.4/ 100
METRIC RATING
123rd/ 347
METRIC RANK
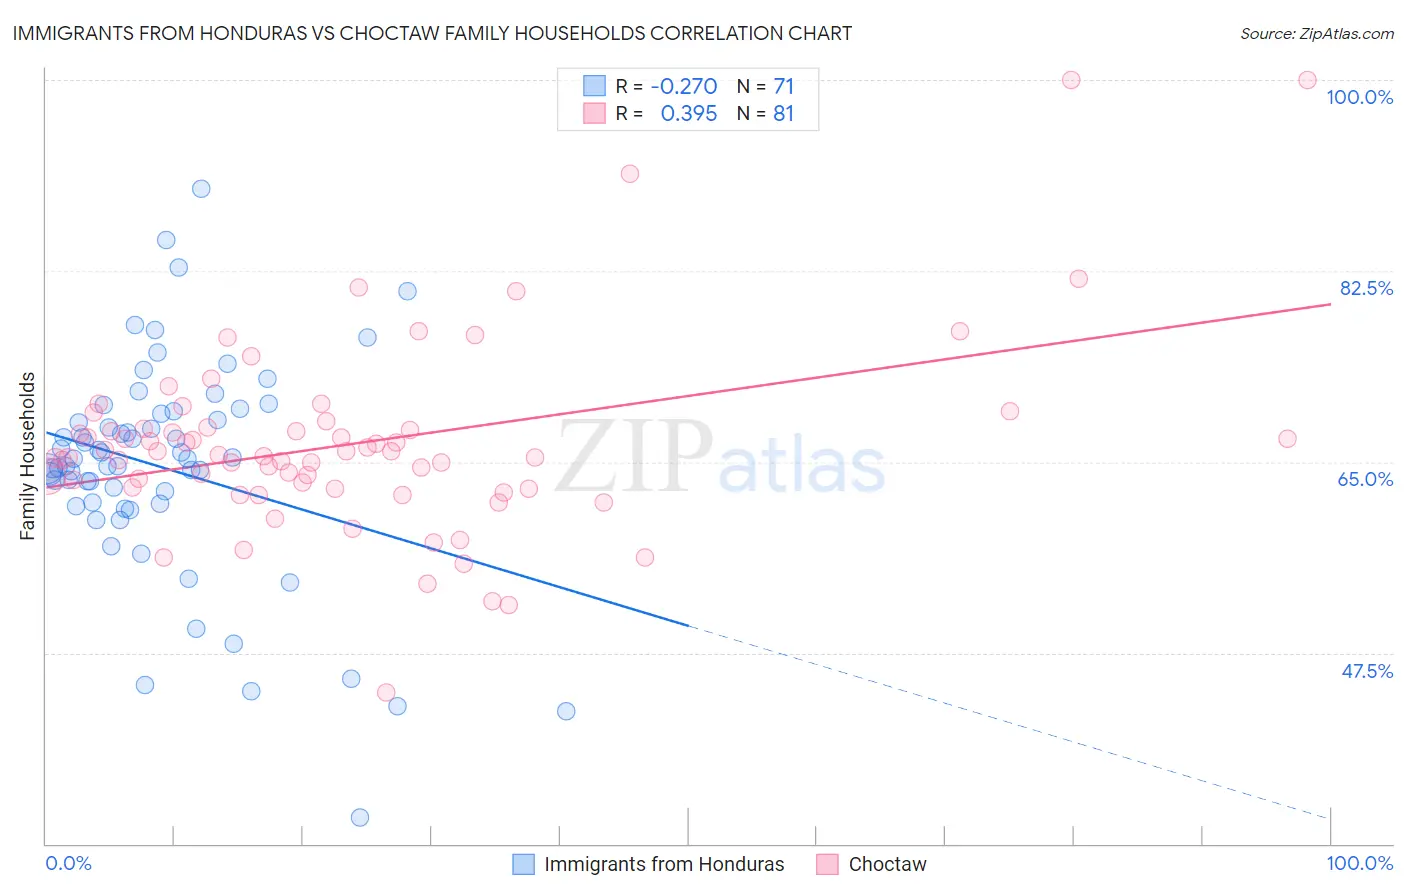
Immigrants from Honduras vs Choctaw Family Households Correlation Chart
The statistical analysis conducted on geographies consisting of 322,466,893 people shows a weak negative correlation between the proportion of Immigrants from Honduras and percentage of family households in the United States with a correlation coefficient (R) of -0.270 and weighted average of 64.2%. Similarly, the statistical analysis conducted on geographies consisting of 269,627,638 people shows a mild positive correlation between the proportion of Choctaw and percentage of family households in the United States with a correlation coefficient (R) of 0.395 and weighted average of 64.9%, a difference of 1.1%.
Family Households Correlation Summary
| Measurement | Immigrants from Honduras | Choctaw |
| Minimum | 32.4% | 43.9% |
| Maximum | 90.0% | 100.0% |
| Range | 57.7% | 56.1% |
| Mean | 64.5% | 66.7% |
| Median | 65.3% | 65.7% |
| Interquartile 25% (IQ1) | 61.2% | 62.6% |
| Interquartile 75% (IQ3) | 69.4% | 68.1% |
| Interquartile Range (IQR) | 8.2% | 5.5% |
| Standard Deviation (Sample) | 10.0% | 8.8% |
| Standard Deviation (Population) | 9.9% | 8.7% |
Similar Demographics by Family Households
Demographics Similar to Immigrants from Honduras by Family Households
In terms of family households, the demographic groups most similar to Immigrants from Honduras are Immigrants from Trinidad and Tobago (64.2%, a difference of 0.0%), Ukrainian (64.2%, a difference of 0.0%), Creek (64.2%, a difference of 0.010%), Puerto Rican (64.2%, a difference of 0.020%), and Immigrants from Ukraine (64.2%, a difference of 0.050%).
| Demographics | Rating | Rank | Family Households |
| Immigrants | Sierra Leone | 52.5 /100 | #173 | Average 64.3% |
| Immigrants | Germany | 50.0 /100 | #174 | Average 64.3% |
| Bangladeshis | 44.3 /100 | #175 | Average 64.3% |
| Vietnamese | 43.6 /100 | #176 | Average 64.2% |
| Immigrants | Micronesia | 42.3 /100 | #177 | Average 64.2% |
| Jamaicans | 40.6 /100 | #178 | Average 64.2% |
| Immigrants | Ukraine | 38.2 /100 | #179 | Fair 64.2% |
| Immigrants | Honduras | 35.0 /100 | #180 | Fair 64.2% |
| Immigrants | Trinidad and Tobago | 34.9 /100 | #181 | Fair 64.2% |
| Ukrainians | 34.6 /100 | #182 | Fair 64.2% |
| Creek | 34.1 /100 | #183 | Fair 64.2% |
| Puerto Ricans | 33.4 /100 | #184 | Fair 64.2% |
| Immigrants | Iran | 30.4 /100 | #185 | Fair 64.1% |
| Spanish Americans | 30.1 /100 | #186 | Fair 64.1% |
| Northern Europeans | 28.2 /100 | #187 | Fair 64.1% |
Demographics Similar to Choctaw by Family Households
In terms of family households, the demographic groups most similar to Choctaw are Hmong (64.9%, a difference of 0.0%), Immigrants from Argentina (64.9%, a difference of 0.030%), Immigrants from Belize (64.9%, a difference of 0.030%), Hungarian (64.9%, a difference of 0.040%), and Immigrants from Oceania (64.9%, a difference of 0.050%).
| Demographics | Rating | Rank | Family Households |
| Immigrants | Iraq | 95.4 /100 | #116 | Exceptional 65.0% |
| Cherokee | 95.3 /100 | #117 | Exceptional 65.0% |
| Dutch | 95.1 /100 | #118 | Exceptional 64.9% |
| Immigrants | Eastern Asia | 94.4 /100 | #119 | Exceptional 64.9% |
| Immigrants | Oceania | 94.2 /100 | #120 | Exceptional 64.9% |
| Hungarians | 94.0 /100 | #121 | Exceptional 64.9% |
| Hmong | 93.4 /100 | #122 | Exceptional 64.9% |
| Choctaw | 93.4 /100 | #123 | Exceptional 64.9% |
| Immigrants | Argentina | 92.8 /100 | #124 | Exceptional 64.9% |
| Immigrants | Belize | 92.7 /100 | #125 | Exceptional 64.9% |
| Panamanians | 92.4 /100 | #126 | Exceptional 64.8% |
| Immigrants | Panama | 92.0 /100 | #127 | Exceptional 64.8% |
| Italians | 91.9 /100 | #128 | Exceptional 64.8% |
| Immigrants | Ecuador | 91.4 /100 | #129 | Exceptional 64.8% |
| Immigrants | Italy | 90.2 /100 | #130 | Exceptional 64.8% |