Honduran vs Comanche Single Father Households
COMPARE
Honduran
Comanche
Single Father Households
Single Father Households Comparison
Hondurans
Comanche
2.8%
SINGLE FATHER HOUSEHOLDS
0.0/ 100
METRIC RATING
297th/ 347
METRIC RANK
2.5%
SINGLE FATHER HOUSEHOLDS
1.0/ 100
METRIC RATING
259th/ 347
METRIC RANK
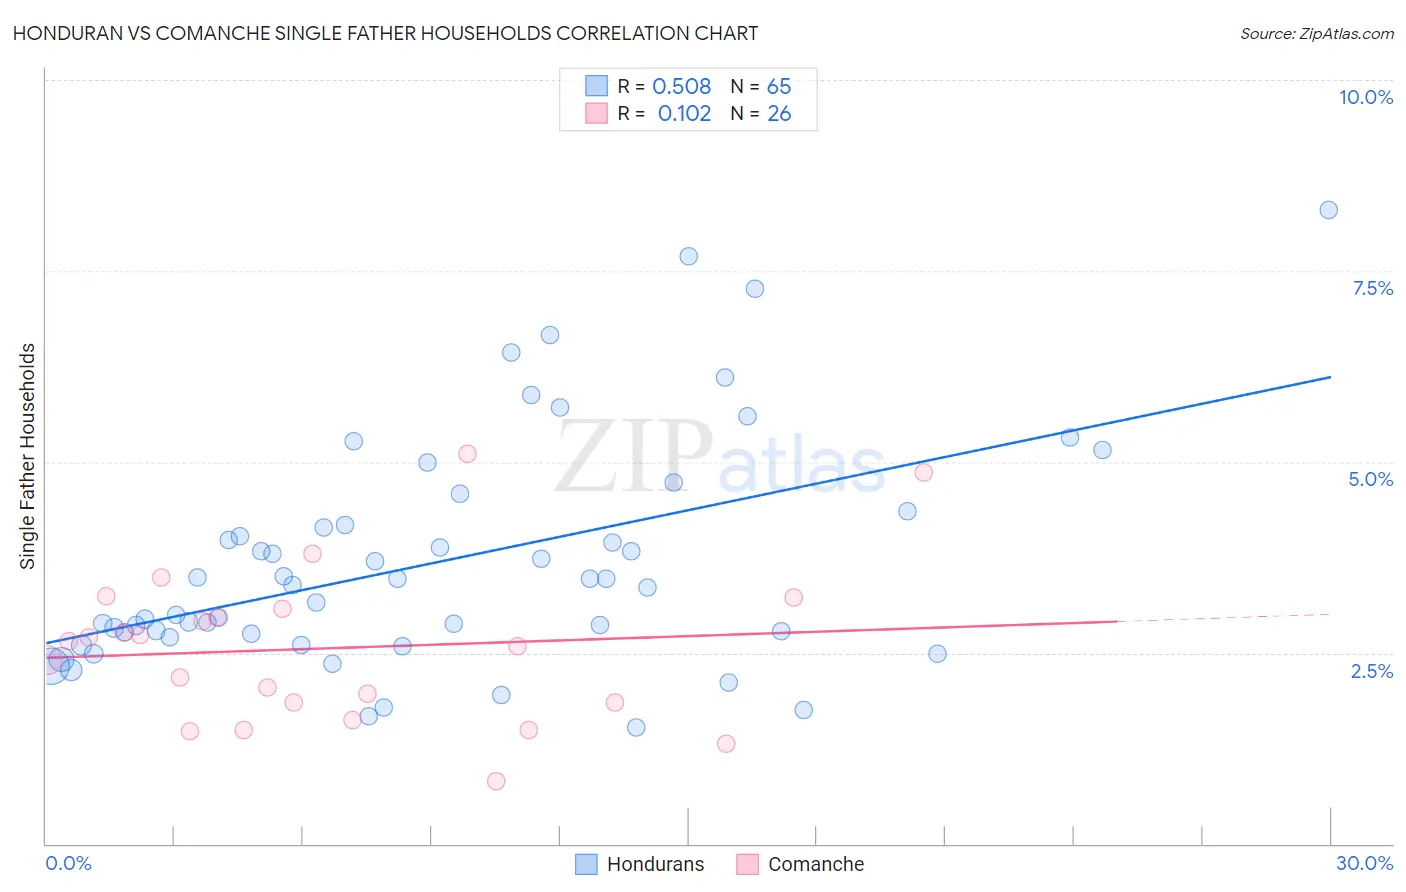
Honduran vs Comanche Single Father Households Correlation Chart
The statistical analysis conducted on geographies consisting of 355,602,571 people shows a substantial positive correlation between the proportion of Hondurans and percentage of single father households in the United States with a correlation coefficient (R) of 0.508 and weighted average of 2.8%. Similarly, the statistical analysis conducted on geographies consisting of 109,445,833 people shows a poor positive correlation between the proportion of Comanche and percentage of single father households in the United States with a correlation coefficient (R) of 0.102 and weighted average of 2.5%, a difference of 8.7%.
Single Father Households Correlation Summary
| Measurement | Honduran | Comanche |
| Minimum | 1.5% | 0.82% |
| Maximum | 8.3% | 5.1% |
| Range | 6.8% | 4.3% |
| Mean | 3.7% | 2.6% |
| Median | 3.4% | 2.6% |
| Interquartile 25% (IQ1) | 2.7% | 1.8% |
| Interquartile 75% (IQ3) | 4.3% | 3.1% |
| Interquartile Range (IQR) | 1.5% | 1.2% |
| Standard Deviation (Sample) | 1.5% | 1.0% |
| Standard Deviation (Population) | 1.5% | 1.0% |
Similar Demographics by Single Father Households
Demographics Similar to Hondurans by Single Father Households
In terms of single father households, the demographic groups most similar to Hondurans are Japanese (2.8%, a difference of 0.080%), Chickasaw (2.8%, a difference of 0.10%), Cree (2.8%, a difference of 0.49%), Lumbee (2.8%, a difference of 0.87%), and Malaysian (2.7%, a difference of 0.91%).
| Demographics | Rating | Rank | Single Father Households |
| Puget Sound Salish | 0.0 /100 | #290 | Tragic 2.7% |
| Blackfeet | 0.0 /100 | #291 | Tragic 2.7% |
| Choctaw | 0.0 /100 | #292 | Tragic 2.7% |
| Immigrants | Fiji | 0.0 /100 | #293 | Tragic 2.7% |
| Malaysians | 0.0 /100 | #294 | Tragic 2.7% |
| Chickasaw | 0.0 /100 | #295 | Tragic 2.8% |
| Japanese | 0.0 /100 | #296 | Tragic 2.8% |
| Hondurans | 0.0 /100 | #297 | Tragic 2.8% |
| Cree | 0.0 /100 | #298 | Tragic 2.8% |
| Lumbee | 0.0 /100 | #299 | Tragic 2.8% |
| Kiowa | 0.0 /100 | #300 | Tragic 2.8% |
| Immigrants | Latin America | 0.0 /100 | #301 | Tragic 2.8% |
| Spanish Americans | 0.0 /100 | #302 | Tragic 2.8% |
| Immigrants | Honduras | 0.0 /100 | #303 | Tragic 2.8% |
| Mexican American Indians | 0.0 /100 | #304 | Tragic 2.8% |
Demographics Similar to Comanche by Single Father Households
In terms of single father households, the demographic groups most similar to Comanche are Immigrants from Caribbean (2.5%, a difference of 0.090%), Spanish (2.5%, a difference of 0.16%), Immigrants from Congo (2.5%, a difference of 0.24%), Immigrants from Belize (2.5%, a difference of 0.25%), and Immigrants from Liberia (2.5%, a difference of 0.40%).
| Demographics | Rating | Rank | Single Father Households |
| Immigrants | Eritrea | 2.0 /100 | #252 | Tragic 2.5% |
| Immigrants | Somalia | 1.9 /100 | #253 | Tragic 2.5% |
| Immigrants | Thailand | 1.8 /100 | #254 | Tragic 2.5% |
| Tongans | 1.5 /100 | #255 | Tragic 2.5% |
| Potawatomi | 1.4 /100 | #256 | Tragic 2.5% |
| Immigrants | Congo | 1.2 /100 | #257 | Tragic 2.5% |
| Spanish | 1.1 /100 | #258 | Tragic 2.5% |
| Comanche | 1.0 /100 | #259 | Tragic 2.5% |
| Immigrants | Caribbean | 1.0 /100 | #260 | Tragic 2.5% |
| Immigrants | Belize | 0.9 /100 | #261 | Tragic 2.5% |
| Immigrants | Liberia | 0.8 /100 | #262 | Tragic 2.5% |
| Dominicans | 0.8 /100 | #263 | Tragic 2.5% |
| Indonesians | 0.5 /100 | #264 | Tragic 2.6% |
| Immigrants | Micronesia | 0.5 /100 | #265 | Tragic 2.6% |
| French American Indians | 0.5 /100 | #266 | Tragic 2.6% |