Israeli vs Aleut Divorced or Separated
COMPARE
Israeli
Aleut
Divorced or Separated
Divorced or Separated Comparison
Israelis
Aleuts
11.3%
DIVORCED OR SEPARATED
99.9/ 100
METRIC RATING
59th/ 347
METRIC RANK
12.5%
DIVORCED OR SEPARATED
1.3/ 100
METRIC RATING
251st/ 347
METRIC RANK
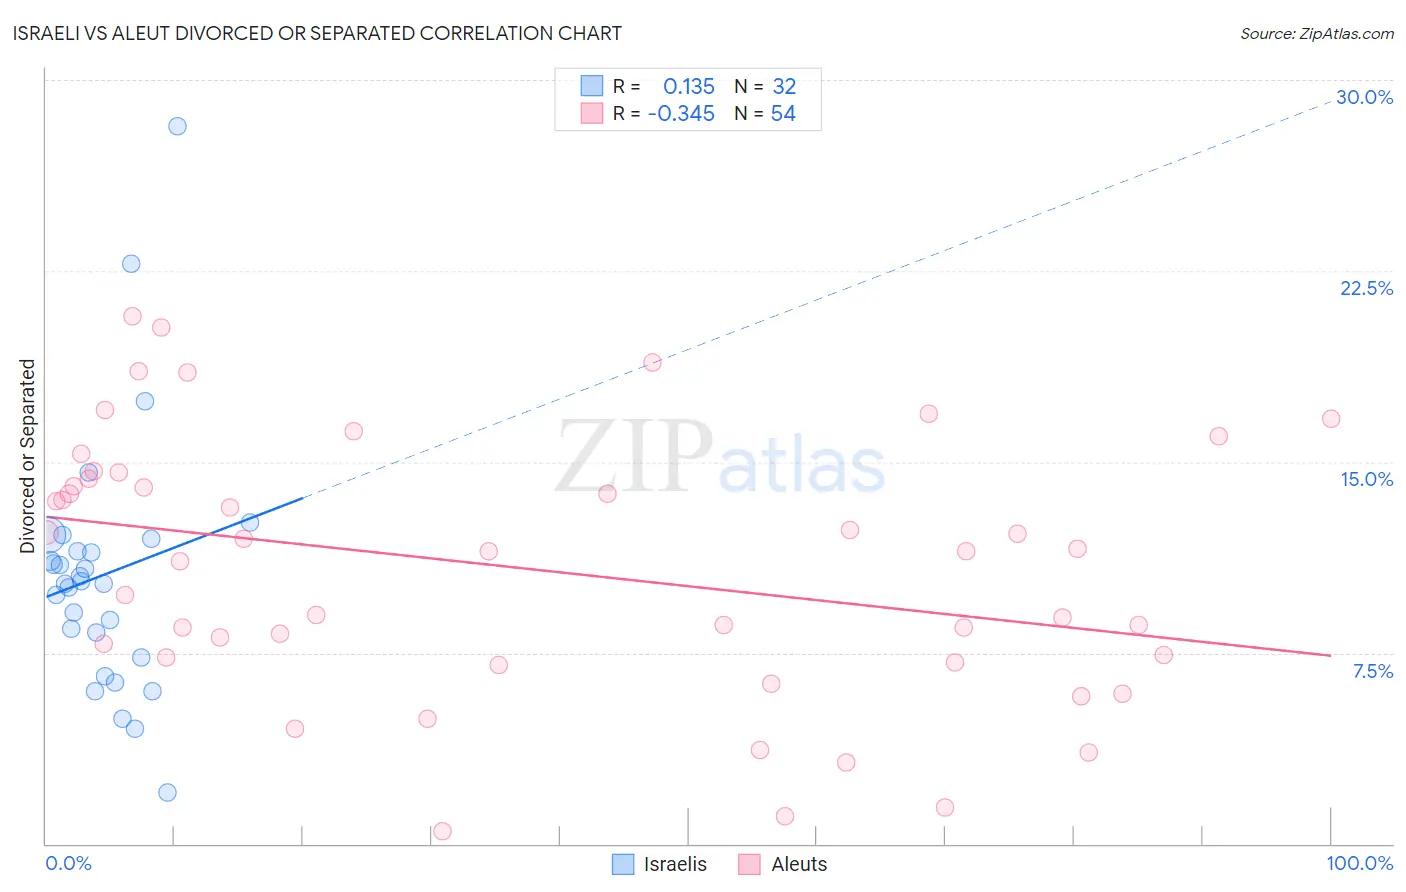
Israeli vs Aleut Divorced or Separated Correlation Chart
The statistical analysis conducted on geographies consisting of 211,065,028 people shows a poor positive correlation between the proportion of Israelis and percentage of population currently divorced or separated in the United States with a correlation coefficient (R) of 0.135 and weighted average of 11.3%. Similarly, the statistical analysis conducted on geographies consisting of 61,777,142 people shows a mild negative correlation between the proportion of Aleuts and percentage of population currently divorced or separated in the United States with a correlation coefficient (R) of -0.345 and weighted average of 12.5%, a difference of 10.4%.
Divorced or Separated Correlation Summary
| Measurement | Israeli | Aleut |
| Minimum | 2.0% | 0.50% |
| Maximum | 28.2% | 20.7% |
| Range | 26.2% | 20.2% |
| Mean | 10.6% | 10.8% |
| Median | 10.3% | 11.5% |
| Interquartile 25% (IQ1) | 7.8% | 7.3% |
| Interquartile 75% (IQ3) | 11.8% | 14.3% |
| Interquartile Range (IQR) | 3.9% | 7.0% |
| Standard Deviation (Sample) | 5.0% | 5.1% |
| Standard Deviation (Population) | 4.9% | 5.0% |
Similar Demographics by Divorced or Separated
Demographics Similar to Israelis by Divorced or Separated
In terms of divorced or separated, the demographic groups most similar to Israelis are Sri Lankan (11.3%, a difference of 0.10%), Immigrants from Vietnam (11.3%, a difference of 0.16%), Immigrants from Russia (11.3%, a difference of 0.16%), Immigrants from Philippines (11.3%, a difference of 0.17%), and Korean (11.3%, a difference of 0.17%).
| Demographics | Rating | Rank | Divorced or Separated |
| Immigrants | Australia | 99.9 /100 | #52 | Exceptional 11.3% |
| Immigrants | Lithuania | 99.9 /100 | #53 | Exceptional 11.3% |
| Eastern Europeans | 99.9 /100 | #54 | Exceptional 11.3% |
| Immigrants | Yemen | 99.9 /100 | #55 | Exceptional 11.3% |
| Immigrants | Philippines | 99.9 /100 | #56 | Exceptional 11.3% |
| Immigrants | Vietnam | 99.9 /100 | #57 | Exceptional 11.3% |
| Sri Lankans | 99.9 /100 | #58 | Exceptional 11.3% |
| Israelis | 99.9 /100 | #59 | Exceptional 11.3% |
| Immigrants | Russia | 99.9 /100 | #60 | Exceptional 11.3% |
| Koreans | 99.9 /100 | #61 | Exceptional 11.3% |
| Luxembourgers | 99.9 /100 | #62 | Exceptional 11.3% |
| Immigrants | Kuwait | 99.9 /100 | #63 | Exceptional 11.3% |
| Macedonians | 99.8 /100 | #64 | Exceptional 11.4% |
| Immigrants | South Eastern Asia | 99.8 /100 | #65 | Exceptional 11.4% |
| Inupiat | 99.8 /100 | #66 | Exceptional 11.4% |
Demographics Similar to Aleuts by Divorced or Separated
In terms of divorced or separated, the demographic groups most similar to Aleuts are Irish (12.5%, a difference of 0.0%), Finnish (12.5%, a difference of 0.28%), Nepalese (12.5%, a difference of 0.29%), German (12.5%, a difference of 0.31%), and Liberian (12.6%, a difference of 0.33%).
| Demographics | Rating | Rank | Divorced or Separated |
| Alaska Natives | 2.5 /100 | #244 | Tragic 12.4% |
| Hispanics or Latinos | 2.0 /100 | #245 | Tragic 12.5% |
| Immigrants | West Indies | 1.9 /100 | #246 | Tragic 12.5% |
| Germans | 1.8 /100 | #247 | Tragic 12.5% |
| Nepalese | 1.8 /100 | #248 | Tragic 12.5% |
| Finns | 1.8 /100 | #249 | Tragic 12.5% |
| Irish | 1.3 /100 | #250 | Tragic 12.5% |
| Aleuts | 1.3 /100 | #251 | Tragic 12.5% |
| Liberians | 0.9 /100 | #252 | Tragic 12.6% |
| Somalis | 0.9 /100 | #253 | Tragic 12.6% |
| Senegalese | 0.8 /100 | #254 | Tragic 12.6% |
| Welsh | 0.7 /100 | #255 | Tragic 12.6% |
| Immigrants | Colombia | 0.6 /100 | #256 | Tragic 12.6% |
| Immigrants | Somalia | 0.6 /100 | #257 | Tragic 12.6% |
| Indonesians | 0.6 /100 | #258 | Tragic 12.6% |