Choctaw vs Immigrants from Zaire Single Mother Households
COMPARE
Choctaw
Immigrants from Zaire
Single Mother Households
Single Mother Households Comparison
Choctaw
Immigrants from Zaire
7.0%
SINGLE MOTHER HOUSEHOLDS
1.4/ 100
METRIC RATING
233rd/ 347
METRIC RANK
7.4%
SINGLE MOTHER HOUSEHOLDS
0.2/ 100
METRIC RATING
260th/ 347
METRIC RANK
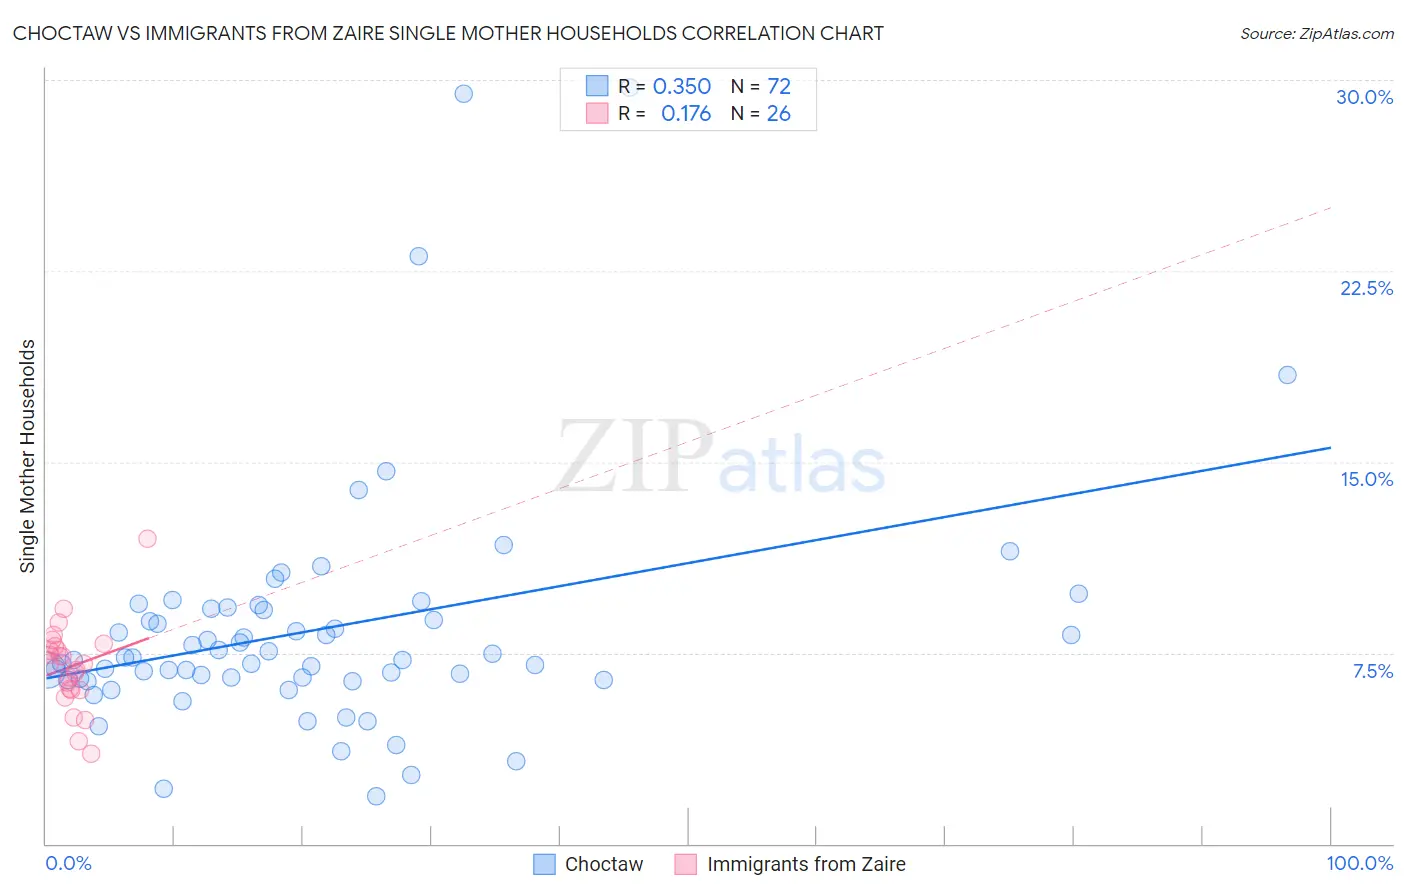
Choctaw vs Immigrants from Zaire Single Mother Households Correlation Chart
The statistical analysis conducted on geographies consisting of 269,186,526 people shows a mild positive correlation between the proportion of Choctaw and percentage of single mother households in the United States with a correlation coefficient (R) of 0.350 and weighted average of 7.0%. Similarly, the statistical analysis conducted on geographies consisting of 107,226,907 people shows a poor positive correlation between the proportion of Immigrants from Zaire and percentage of single mother households in the United States with a correlation coefficient (R) of 0.176 and weighted average of 7.4%, a difference of 5.1%.
Single Mother Households Correlation Summary
| Measurement | Choctaw | Immigrants from Zaire |
| Minimum | 1.9% | 3.5% |
| Maximum | 29.7% | 12.0% |
| Range | 27.9% | 8.5% |
| Mean | 8.4% | 7.0% |
| Median | 7.3% | 7.1% |
| Interquartile 25% (IQ1) | 6.5% | 6.1% |
| Interquartile 75% (IQ3) | 9.2% | 7.8% |
| Interquartile Range (IQR) | 2.8% | 1.7% |
| Standard Deviation (Sample) | 4.8% | 1.7% |
| Standard Deviation (Population) | 4.8% | 1.7% |
Similar Demographics by Single Mother Households
Demographics Similar to Choctaw by Single Mother Households
In terms of single mother households, the demographic groups most similar to Choctaw are Chickasaw (7.0%, a difference of 0.020%), Immigrants from Burma/Myanmar (7.0%, a difference of 0.090%), Comanche (7.0%, a difference of 0.17%), Spanish American (7.0%, a difference of 0.23%), and Creek (7.0%, a difference of 0.25%).
| Demographics | Rating | Rank | Single Mother Households |
| Paiute | 2.4 /100 | #226 | Tragic 7.0% |
| Kenyans | 2.3 /100 | #227 | Tragic 7.0% |
| Iroquois | 2.2 /100 | #228 | Tragic 7.0% |
| Immigrants | Kenya | 2.1 /100 | #229 | Tragic 7.0% |
| Creek | 1.6 /100 | #230 | Tragic 7.0% |
| Spanish Americans | 1.6 /100 | #231 | Tragic 7.0% |
| Comanche | 1.5 /100 | #232 | Tragic 7.0% |
| Choctaw | 1.4 /100 | #233 | Tragic 7.0% |
| Chickasaw | 1.4 /100 | #234 | Tragic 7.0% |
| Immigrants | Burma/Myanmar | 1.4 /100 | #235 | Tragic 7.0% |
| Ute | 1.0 /100 | #236 | Tragic 7.1% |
| Arapaho | 1.0 /100 | #237 | Tragic 7.1% |
| Panamanians | 0.9 /100 | #238 | Tragic 7.1% |
| Kiowa | 0.8 /100 | #239 | Tragic 7.1% |
| Immigrants | Panama | 0.7 /100 | #240 | Tragic 7.2% |
Demographics Similar to Immigrants from Zaire by Single Mother Households
In terms of single mother households, the demographic groups most similar to Immigrants from Zaire are Japanese (7.4%, a difference of 0.020%), Immigrants from Yemen (7.4%, a difference of 0.040%), Pueblo (7.4%, a difference of 0.060%), Alaska Native (7.4%, a difference of 0.080%), and Seminole (7.4%, a difference of 0.13%).
| Demographics | Rating | Rank | Single Mother Households |
| Cajuns | 0.3 /100 | #253 | Tragic 7.3% |
| Immigrants | Ecuador | 0.3 /100 | #254 | Tragic 7.3% |
| Mexican American Indians | 0.2 /100 | #255 | Tragic 7.4% |
| Seminole | 0.2 /100 | #256 | Tragic 7.4% |
| Alaska Natives | 0.2 /100 | #257 | Tragic 7.4% |
| Pueblo | 0.2 /100 | #258 | Tragic 7.4% |
| Immigrants | Yemen | 0.2 /100 | #259 | Tragic 7.4% |
| Immigrants | Zaire | 0.2 /100 | #260 | Tragic 7.4% |
| Japanese | 0.2 /100 | #261 | Tragic 7.4% |
| Immigrants | Somalia | 0.2 /100 | #262 | Tragic 7.4% |
| Immigrants | Nicaragua | 0.2 /100 | #263 | Tragic 7.4% |
| Yaqui | 0.1 /100 | #264 | Tragic 7.4% |
| Crow | 0.1 /100 | #265 | Tragic 7.4% |
| Nepalese | 0.1 /100 | #266 | Tragic 7.5% |
| Blackfeet | 0.1 /100 | #267 | Tragic 7.5% |