Slavic vs Immigrants from Uruguay Unemployment Among Seniors over 75 years
COMPARE
Slavic
Immigrants from Uruguay
Unemployment Among Seniors over 75 years
Unemployment Among Seniors over 75 years Comparison
Slavs
Immigrants from Uruguay
9.2%
UNEMPLOYMENT AMONG SENIORS OVER 75 YEARS
2.8/ 100
METRIC RATING
243rd/ 347
METRIC RANK
7.5%
UNEMPLOYMENT AMONG SENIORS OVER 75 YEARS
100.0/ 100
METRIC RATING
25th/ 347
METRIC RANK
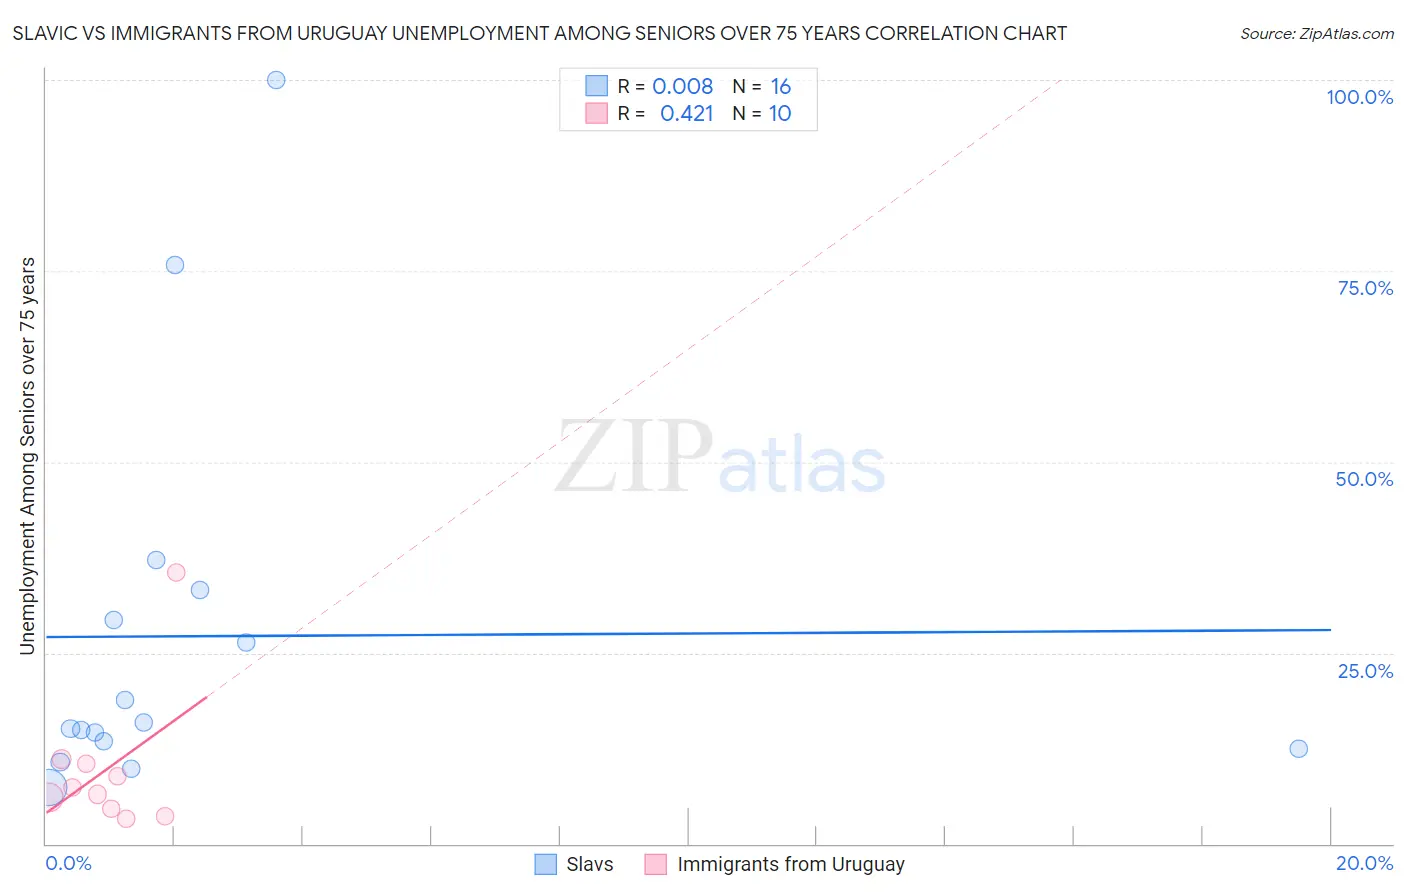
Slavic vs Immigrants from Uruguay Unemployment Among Seniors over 75 years Correlation Chart
The statistical analysis conducted on geographies consisting of 156,332,255 people shows no correlation between the proportion of Slavs and unemployment rate among seniors over the age of 75 in the United States with a correlation coefficient (R) of 0.008 and weighted average of 9.2%. Similarly, the statistical analysis conducted on geographies consisting of 96,799,113 people shows a moderate positive correlation between the proportion of Immigrants from Uruguay and unemployment rate among seniors over the age of 75 in the United States with a correlation coefficient (R) of 0.421 and weighted average of 7.5%, a difference of 21.9%.
Unemployment Among Seniors over 75 years Correlation Summary
| Measurement | Slavic | Immigrants from Uruguay |
| Minimum | 7.4% | 3.2% |
| Maximum | 100.0% | 35.5% |
| Range | 92.6% | 32.3% |
| Mean | 27.2% | 9.7% |
| Median | 15.4% | 6.9% |
| Interquartile 25% (IQ1) | 13.0% | 4.5% |
| Interquartile 75% (IQ3) | 31.3% | 10.5% |
| Interquartile Range (IQR) | 18.4% | 5.9% |
| Standard Deviation (Sample) | 25.6% | 9.5% |
| Standard Deviation (Population) | 24.8% | 9.0% |
Similar Demographics by Unemployment Among Seniors over 75 years
Demographics Similar to Slavs by Unemployment Among Seniors over 75 years
In terms of unemployment among seniors over 75 years, the demographic groups most similar to Slavs are Sierra Leonean (9.2%, a difference of 0.0%), Immigrants from Southern Europe (9.2%, a difference of 0.030%), Immigrants from Germany (9.2%, a difference of 0.030%), Immigrants from Canada (9.2%, a difference of 0.090%), and Immigrants from North America (9.2%, a difference of 0.21%).
| Demographics | Rating | Rank | Unemployment Among Seniors over 75 years |
| Jordanians | 4.0 /100 | #236 | Tragic 9.1% |
| Houma | 3.9 /100 | #237 | Tragic 9.1% |
| Inupiat | 3.6 /100 | #238 | Tragic 9.1% |
| Mexicans | 3.5 /100 | #239 | Tragic 9.1% |
| Spanish | 3.3 /100 | #240 | Tragic 9.1% |
| Immigrants | Southern Europe | 2.8 /100 | #241 | Tragic 9.2% |
| Sierra Leoneans | 2.8 /100 | #242 | Tragic 9.2% |
| Slavs | 2.8 /100 | #243 | Tragic 9.2% |
| Immigrants | Germany | 2.7 /100 | #244 | Tragic 9.2% |
| Immigrants | Canada | 2.6 /100 | #245 | Tragic 9.2% |
| Immigrants | North America | 2.4 /100 | #246 | Tragic 9.2% |
| Sub-Saharan Africans | 2.3 /100 | #247 | Tragic 9.2% |
| Blackfeet | 2.3 /100 | #248 | Tragic 9.2% |
| Immigrants | Saudi Arabia | 2.2 /100 | #249 | Tragic 9.2% |
| Central American Indians | 2.2 /100 | #250 | Tragic 9.2% |
Demographics Similar to Immigrants from Uruguay by Unemployment Among Seniors over 75 years
In terms of unemployment among seniors over 75 years, the demographic groups most similar to Immigrants from Uruguay are South African (7.5%, a difference of 0.18%), Immigrants from Barbados (7.6%, a difference of 0.62%), Immigrants from Israel (7.6%, a difference of 0.73%), Immigrants from Iran (7.6%, a difference of 0.78%), and Immigrants from Sweden (7.6%, a difference of 0.89%).
| Demographics | Rating | Rank | Unemployment Among Seniors over 75 years |
| Immigrants | Uzbekistan | 100.0 /100 | #18 | Exceptional 7.2% |
| Immigrants | Zaire | 100.0 /100 | #19 | Exceptional 7.2% |
| Armenians | 100.0 /100 | #20 | Exceptional 7.2% |
| Chickasaw | 100.0 /100 | #21 | Exceptional 7.3% |
| Cypriots | 100.0 /100 | #22 | Exceptional 7.4% |
| Israelis | 100.0 /100 | #23 | Exceptional 7.4% |
| Immigrants | Cuba | 100.0 /100 | #24 | Exceptional 7.4% |
| Immigrants | Uruguay | 100.0 /100 | #25 | Exceptional 7.5% |
| South Africans | 100.0 /100 | #26 | Exceptional 7.5% |
| Immigrants | Barbados | 100.0 /100 | #27 | Exceptional 7.6% |
| Immigrants | Israel | 100.0 /100 | #28 | Exceptional 7.6% |
| Immigrants | Iran | 100.0 /100 | #29 | Exceptional 7.6% |
| Immigrants | Sweden | 100.0 /100 | #30 | Exceptional 7.6% |
| Guyanese | 100.0 /100 | #31 | Exceptional 7.6% |
| Immigrants | Hong Kong | 100.0 /100 | #32 | Exceptional 7.6% |