Slavic vs Immigrants from Uruguay 4th Grade
COMPARE
Slavic
Immigrants from Uruguay
4th Grade
4th Grade Comparison
Slavs
Immigrants from Uruguay
98.1%
4TH GRADE
99.8/ 100
METRIC RATING
53rd/ 347
METRIC RANK
97.1%
4TH GRADE
1.2/ 100
METRIC RATING
246th/ 347
METRIC RANK
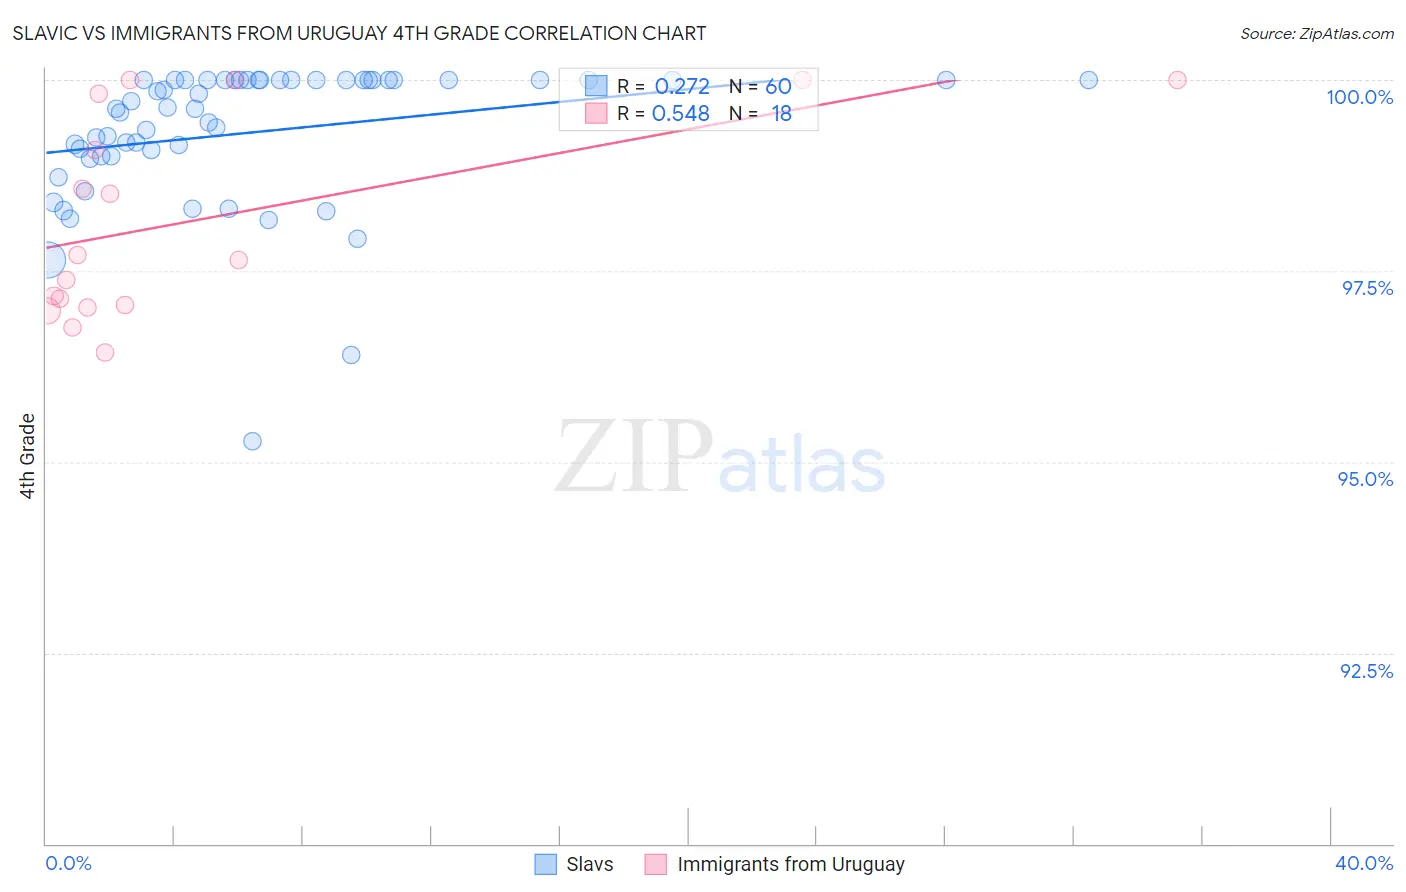
Slavic vs Immigrants from Uruguay 4th Grade Correlation Chart
The statistical analysis conducted on geographies consisting of 270,869,056 people shows a weak positive correlation between the proportion of Slavs and percentage of population with at least 4th grade education in the United States with a correlation coefficient (R) of 0.272 and weighted average of 98.1%. Similarly, the statistical analysis conducted on geographies consisting of 133,259,667 people shows a substantial positive correlation between the proportion of Immigrants from Uruguay and percentage of population with at least 4th grade education in the United States with a correlation coefficient (R) of 0.548 and weighted average of 97.1%, a difference of 1.0%.
4th Grade Correlation Summary
| Measurement | Slavic | Immigrants from Uruguay |
| Minimum | 95.3% | 96.4% |
| Maximum | 100.0% | 100.0% |
| Range | 4.7% | 3.6% |
| Mean | 99.3% | 98.2% |
| Median | 99.6% | 97.7% |
| Interquartile 25% (IQ1) | 99.0% | 97.1% |
| Interquartile 75% (IQ3) | 100.0% | 99.8% |
| Interquartile Range (IQR) | 1.00% | 2.8% |
| Standard Deviation (Sample) | 0.94% | 1.3% |
| Standard Deviation (Population) | 0.93% | 1.3% |
Similar Demographics by 4th Grade
Demographics Similar to Slavs by 4th Grade
In terms of 4th grade, the demographic groups most similar to Slavs are Australian (98.1%, a difference of 0.0%), Maltese (98.1%, a difference of 0.0%), White/Caucasian (98.1%, a difference of 0.0%), Bulgarian (98.1%, a difference of 0.010%), and Immigrants from Scotland (98.1%, a difference of 0.010%).
| Demographics | Rating | Rank | 4th Grade |
| Ottawa | 99.9 /100 | #46 | Exceptional 98.1% |
| Arapaho | 99.9 /100 | #47 | Exceptional 98.1% |
| Estonians | 99.8 /100 | #48 | Exceptional 98.1% |
| Bulgarians | 99.8 /100 | #49 | Exceptional 98.1% |
| Immigrants | Scotland | 99.8 /100 | #50 | Exceptional 98.1% |
| Celtics | 99.8 /100 | #51 | Exceptional 98.1% |
| Australians | 99.8 /100 | #52 | Exceptional 98.1% |
| Slavs | 99.8 /100 | #53 | Exceptional 98.1% |
| Maltese | 99.8 /100 | #54 | Exceptional 98.1% |
| Whites/Caucasians | 99.8 /100 | #55 | Exceptional 98.1% |
| Greeks | 99.8 /100 | #56 | Exceptional 98.1% |
| Austrians | 99.8 /100 | #57 | Exceptional 98.1% |
| Creek | 99.8 /100 | #58 | Exceptional 98.1% |
| Americans | 99.8 /100 | #59 | Exceptional 98.1% |
| Immigrants | Canada | 99.7 /100 | #60 | Exceptional 98.1% |
Demographics Similar to Immigrants from Uruguay by 4th Grade
In terms of 4th grade, the demographic groups most similar to Immigrants from Uruguay are Korean (97.1%, a difference of 0.0%), Immigrants from Eastern Africa (97.1%, a difference of 0.0%), Ethiopian (97.1%, a difference of 0.0%), Immigrants from Asia (97.1%, a difference of 0.0%), and Asian (97.1%, a difference of 0.010%).
| Demographics | Rating | Rank | 4th Grade |
| Nigerians | 1.8 /100 | #239 | Tragic 97.1% |
| Colombians | 1.6 /100 | #240 | Tragic 97.1% |
| Immigrants | Indonesia | 1.5 /100 | #241 | Tragic 97.1% |
| Asians | 1.4 /100 | #242 | Tragic 97.1% |
| U.S. Virgin Islanders | 1.4 /100 | #243 | Tragic 97.1% |
| Koreans | 1.3 /100 | #244 | Tragic 97.1% |
| Immigrants | Eastern Africa | 1.2 /100 | #245 | Tragic 97.1% |
| Immigrants | Uruguay | 1.2 /100 | #246 | Tragic 97.1% |
| Ethiopians | 1.2 /100 | #247 | Tragic 97.1% |
| Immigrants | Asia | 1.2 /100 | #248 | Tragic 97.1% |
| Immigrants | Africa | 1.0 /100 | #249 | Tragic 97.1% |
| Immigrants | Senegal | 0.9 /100 | #250 | Tragic 97.1% |
| South Americans | 0.8 /100 | #251 | Tragic 97.1% |
| Jamaicans | 0.8 /100 | #252 | Tragic 97.1% |
| Immigrants | Liberia | 0.8 /100 | #253 | Tragic 97.1% |