Immigrants from Japan vs Immigrants from Scotland Single Mother Households
COMPARE
Immigrants from Japan
Immigrants from Scotland
Single Mother Households
Single Mother Households Comparison
Immigrants from Japan
Immigrants from Scotland
5.2%
SINGLE MOTHER HOUSEHOLDS
99.8/ 100
METRIC RATING
25th/ 347
METRIC RANK
5.5%
SINGLE MOTHER HOUSEHOLDS
99.2/ 100
METRIC RATING
50th/ 347
METRIC RANK
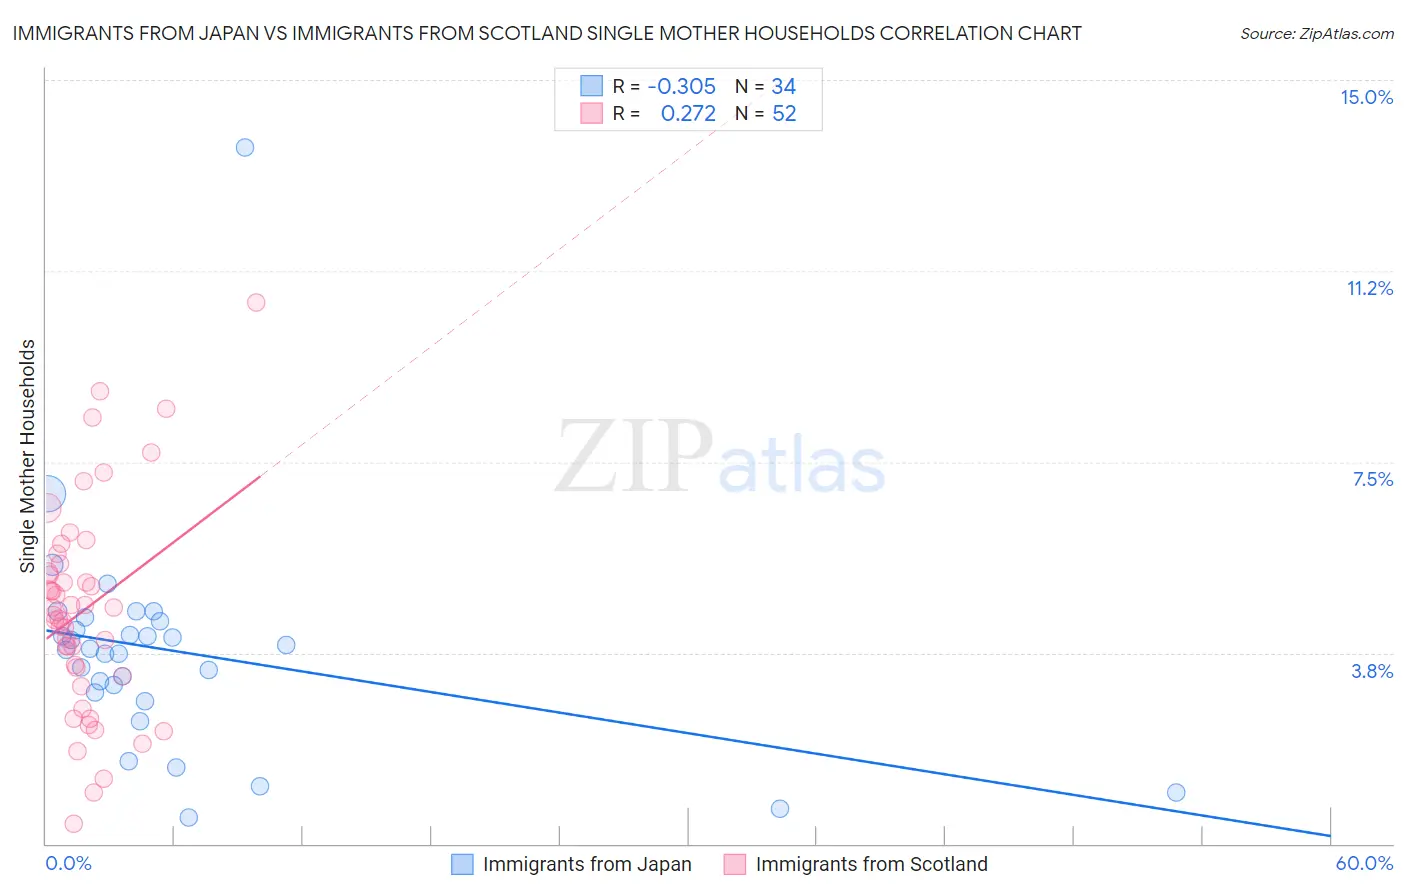
Immigrants from Japan vs Immigrants from Scotland Single Mother Households Correlation Chart
The statistical analysis conducted on geographies consisting of 339,363,268 people shows a mild negative correlation between the proportion of Immigrants from Japan and percentage of single mother households in the United States with a correlation coefficient (R) of -0.305 and weighted average of 5.2%. Similarly, the statistical analysis conducted on geographies consisting of 195,996,890 people shows a weak positive correlation between the proportion of Immigrants from Scotland and percentage of single mother households in the United States with a correlation coefficient (R) of 0.272 and weighted average of 5.5%, a difference of 4.5%.
Single Mother Households Correlation Summary
| Measurement | Immigrants from Japan | Immigrants from Scotland |
| Minimum | 0.51% | 0.38% |
| Maximum | 13.7% | 10.6% |
| Range | 13.2% | 10.2% |
| Mean | 3.8% | 4.6% |
| Median | 3.8% | 4.6% |
| Interquartile 25% (IQ1) | 3.0% | 3.4% |
| Interquartile 75% (IQ3) | 4.4% | 5.4% |
| Interquartile Range (IQR) | 1.4% | 2.0% |
| Standard Deviation (Sample) | 2.2% | 2.1% |
| Standard Deviation (Population) | 2.2% | 2.0% |
Similar Demographics by Single Mother Households
Demographics Similar to Immigrants from Japan by Single Mother Households
In terms of single mother households, the demographic groups most similar to Immigrants from Japan are Immigrants from Lithuania (5.3%, a difference of 0.030%), Armenian (5.2%, a difference of 0.34%), Immigrants from Austria (5.2%, a difference of 0.39%), Thai (5.2%, a difference of 0.44%), and Bhutanese (5.3%, a difference of 0.54%).
| Demographics | Rating | Rank | Single Mother Households |
| Immigrants | Armenia | 99.9 /100 | #18 | Exceptional 5.2% |
| Chinese | 99.9 /100 | #19 | Exceptional 5.2% |
| Maltese | 99.9 /100 | #20 | Exceptional 5.2% |
| Eastern Europeans | 99.8 /100 | #21 | Exceptional 5.2% |
| Thais | 99.8 /100 | #22 | Exceptional 5.2% |
| Immigrants | Austria | 99.8 /100 | #23 | Exceptional 5.2% |
| Armenians | 99.8 /100 | #24 | Exceptional 5.2% |
| Immigrants | Japan | 99.8 /100 | #25 | Exceptional 5.2% |
| Immigrants | Lithuania | 99.8 /100 | #26 | Exceptional 5.3% |
| Bhutanese | 99.7 /100 | #27 | Exceptional 5.3% |
| Russians | 99.7 /100 | #28 | Exceptional 5.3% |
| Latvians | 99.7 /100 | #29 | Exceptional 5.3% |
| Burmese | 99.7 /100 | #30 | Exceptional 5.3% |
| Immigrants | Korea | 99.7 /100 | #31 | Exceptional 5.3% |
| Cambodians | 99.7 /100 | #32 | Exceptional 5.3% |
Demographics Similar to Immigrants from Scotland by Single Mother Households
In terms of single mother households, the demographic groups most similar to Immigrants from Scotland are Immigrants from Belarus (5.5%, a difference of 0.020%), Swedish (5.5%, a difference of 0.080%), Immigrants from Russia (5.5%, a difference of 0.18%), Immigrants from Latvia (5.5%, a difference of 0.19%), and Immigrants from Lebanon (5.5%, a difference of 0.20%).
| Demographics | Rating | Rank | Single Mother Households |
| Immigrants | South Central Asia | 99.5 /100 | #43 | Exceptional 5.4% |
| Lithuanians | 99.4 /100 | #44 | Exceptional 5.4% |
| Immigrants | Croatia | 99.4 /100 | #45 | Exceptional 5.4% |
| Croatians | 99.3 /100 | #46 | Exceptional 5.5% |
| Norwegians | 99.3 /100 | #47 | Exceptional 5.5% |
| Turks | 99.2 /100 | #48 | Exceptional 5.5% |
| Immigrants | Latvia | 99.2 /100 | #49 | Exceptional 5.5% |
| Immigrants | Scotland | 99.2 /100 | #50 | Exceptional 5.5% |
| Immigrants | Belarus | 99.2 /100 | #51 | Exceptional 5.5% |
| Swedes | 99.1 /100 | #52 | Exceptional 5.5% |
| Immigrants | Russia | 99.1 /100 | #53 | Exceptional 5.5% |
| Immigrants | Lebanon | 99.1 /100 | #54 | Exceptional 5.5% |
| Immigrants | Denmark | 99.1 /100 | #55 | Exceptional 5.5% |
| Immigrants | Romania | 99.0 /100 | #56 | Exceptional 5.5% |
| Immigrants | Europe | 99.0 /100 | #57 | Exceptional 5.5% |