Sierra Leonean vs White/Caucasian Divorced or Separated
COMPARE
Sierra Leonean
White/Caucasian
Divorced or Separated
Divorced or Separated Comparison
Sierra Leoneans
Whites/Caucasians
12.1%
DIVORCED OR SEPARATED
35.5/ 100
METRIC RATING
189th/ 347
METRIC RANK
12.6%
DIVORCED OR SEPARATED
0.5/ 100
METRIC RATING
266th/ 347
METRIC RANK
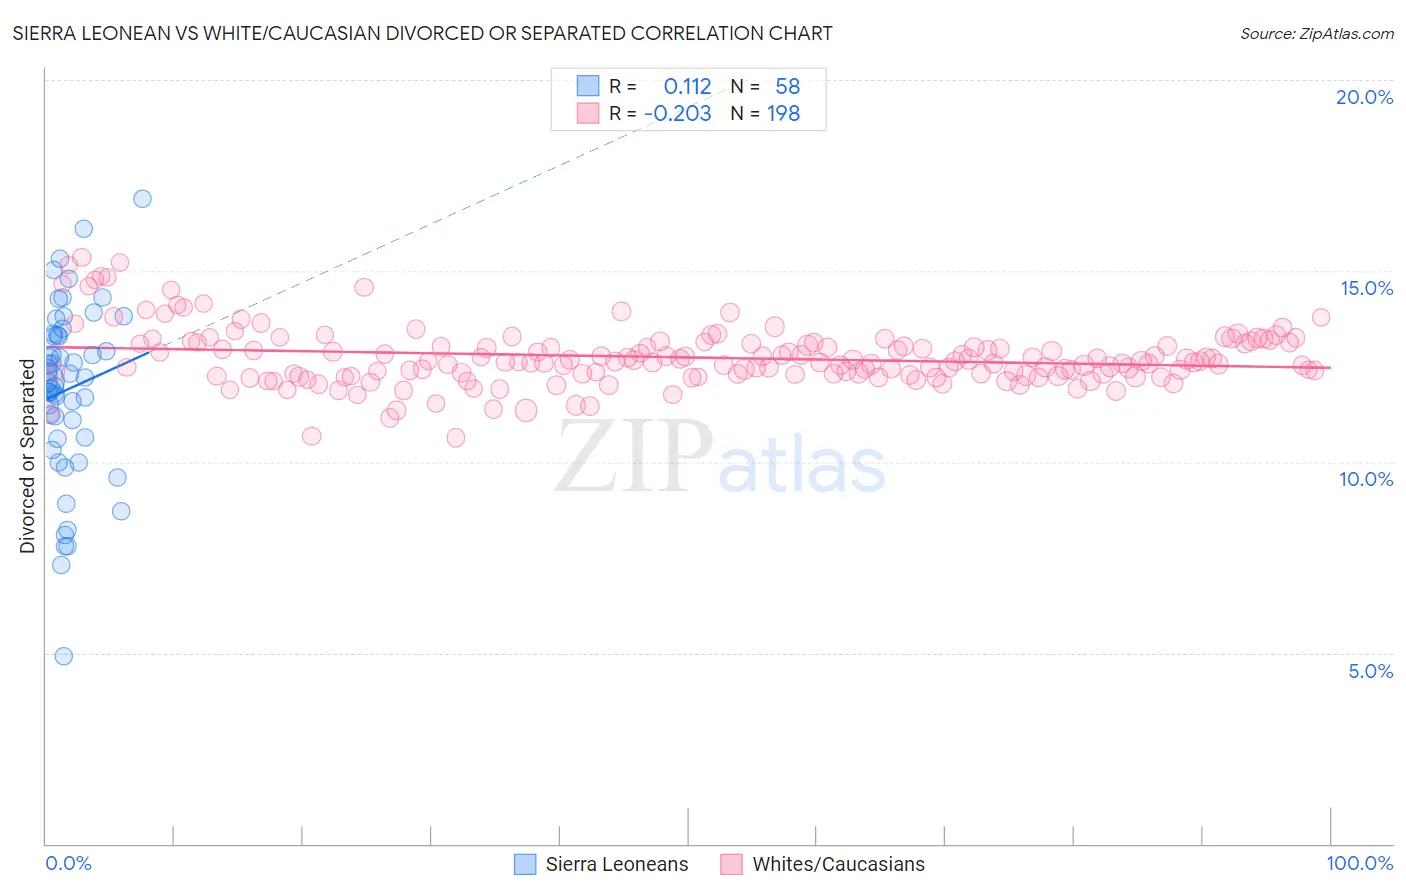
Sierra Leonean vs White/Caucasian Divorced or Separated Correlation Chart
The statistical analysis conducted on geographies consisting of 83,352,562 people shows a poor positive correlation between the proportion of Sierra Leoneans and percentage of population currently divorced or separated in the United States with a correlation coefficient (R) of 0.112 and weighted average of 12.1%. Similarly, the statistical analysis conducted on geographies consisting of 582,391,050 people shows a weak negative correlation between the proportion of Whites/Caucasians and percentage of population currently divorced or separated in the United States with a correlation coefficient (R) of -0.203 and weighted average of 12.6%, a difference of 4.1%.
Divorced or Separated Correlation Summary
| Measurement | Sierra Leonean | White/Caucasian |
| Minimum | 4.9% | 10.6% |
| Maximum | 16.9% | 15.4% |
| Range | 12.0% | 4.7% |
| Mean | 11.9% | 12.7% |
| Median | 12.2% | 12.6% |
| Interquartile 25% (IQ1) | 10.6% | 12.3% |
| Interquartile 75% (IQ3) | 13.3% | 13.1% |
| Interquartile Range (IQR) | 2.7% | 0.82% |
| Standard Deviation (Sample) | 2.3% | 0.77% |
| Standard Deviation (Population) | 2.3% | 0.77% |
Similar Demographics by Divorced or Separated
Demographics Similar to Sierra Leoneans by Divorced or Separated
In terms of divorced or separated, the demographic groups most similar to Sierra Leoneans are Moroccan (12.1%, a difference of 0.030%), Swedish (12.1%, a difference of 0.040%), Belizean (12.1%, a difference of 0.080%), Immigrants from Belize (12.1%, a difference of 0.080%), and Norwegian (12.1%, a difference of 0.090%).
| Demographics | Rating | Rank | Divorced or Separated |
| Immigrants | Ethiopia | 43.1 /100 | #182 | Average 12.1% |
| Immigrants | Central America | 42.9 /100 | #183 | Average 12.1% |
| Immigrants | North America | 41.1 /100 | #184 | Average 12.1% |
| Immigrants | Nigeria | 40.5 /100 | #185 | Average 12.1% |
| Immigrants | Chile | 39.0 /100 | #186 | Fair 12.1% |
| Belizeans | 37.7 /100 | #187 | Fair 12.1% |
| Immigrants | Belize | 37.6 /100 | #188 | Fair 12.1% |
| Sierra Leoneans | 35.5 /100 | #189 | Fair 12.1% |
| Moroccans | 34.8 /100 | #190 | Fair 12.1% |
| Swedes | 34.4 /100 | #191 | Fair 12.1% |
| Norwegians | 33.2 /100 | #192 | Fair 12.1% |
| Immigrants | Thailand | 32.5 /100 | #193 | Fair 12.1% |
| Immigrants | Eritrea | 31.9 /100 | #194 | Fair 12.1% |
| Immigrants | England | 31.4 /100 | #195 | Fair 12.1% |
| Immigrants | Burma/Myanmar | 30.4 /100 | #196 | Fair 12.1% |
Demographics Similar to Whites/Caucasians by Divorced or Separated
In terms of divorced or separated, the demographic groups most similar to Whites/Caucasians are Immigrants from Senegal (12.6%, a difference of 0.010%), English (12.6%, a difference of 0.030%), Scottish (12.6%, a difference of 0.040%), Immigrants from Panama (12.6%, a difference of 0.050%), and Fijian (12.6%, a difference of 0.060%).
| Demographics | Rating | Rank | Divorced or Separated |
| Yuman | 0.6 /100 | #259 | Tragic 12.6% |
| Immigrants | Uruguay | 0.6 /100 | #260 | Tragic 12.6% |
| Immigrants | Dominica | 0.5 /100 | #261 | Tragic 12.6% |
| Basques | 0.5 /100 | #262 | Tragic 12.6% |
| Immigrants | Panama | 0.5 /100 | #263 | Tragic 12.6% |
| English | 0.5 /100 | #264 | Tragic 12.6% |
| Immigrants | Senegal | 0.5 /100 | #265 | Tragic 12.6% |
| Whites/Caucasians | 0.5 /100 | #266 | Tragic 12.6% |
| Scottish | 0.4 /100 | #267 | Tragic 12.6% |
| Fijians | 0.4 /100 | #268 | Tragic 12.6% |
| Immigrants | Liberia | 0.4 /100 | #269 | Tragic 12.6% |
| Ute | 0.4 /100 | #270 | Tragic 12.6% |
| Panamanians | 0.3 /100 | #271 | Tragic 12.7% |
| Immigrants | Middle Africa | 0.3 /100 | #272 | Tragic 12.7% |
| Immigrants | Micronesia | 0.3 /100 | #273 | Tragic 12.7% |