Immigrants from Egypt vs White/Caucasian Divorced or Separated
COMPARE
Immigrants from Egypt
White/Caucasian
Divorced or Separated
Divorced or Separated Comparison
Immigrants from Egypt
Whites/Caucasians
11.1%
DIVORCED OR SEPARATED
100.0/ 100
METRIC RATING
39th/ 347
METRIC RANK
12.6%
DIVORCED OR SEPARATED
0.5/ 100
METRIC RATING
266th/ 347
METRIC RANK
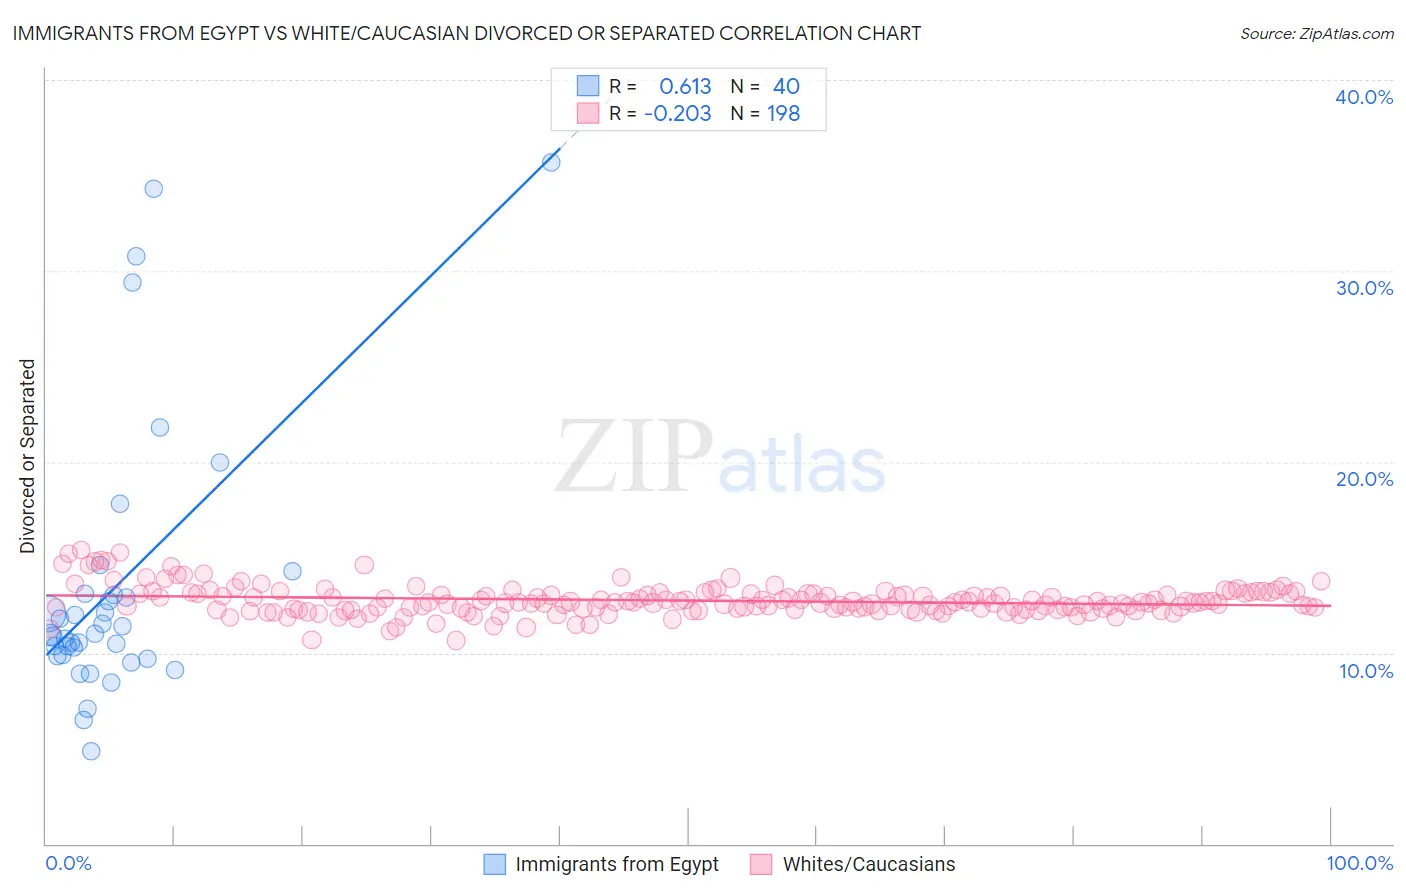
Immigrants from Egypt vs White/Caucasian Divorced or Separated Correlation Chart
The statistical analysis conducted on geographies consisting of 245,438,594 people shows a significant positive correlation between the proportion of Immigrants from Egypt and percentage of population currently divorced or separated in the United States with a correlation coefficient (R) of 0.613 and weighted average of 11.1%. Similarly, the statistical analysis conducted on geographies consisting of 582,391,050 people shows a weak negative correlation between the proportion of Whites/Caucasians and percentage of population currently divorced or separated in the United States with a correlation coefficient (R) of -0.203 and weighted average of 12.6%, a difference of 13.3%.
Divorced or Separated Correlation Summary
| Measurement | Immigrants from Egypt | White/Caucasian |
| Minimum | 4.8% | 10.6% |
| Maximum | 35.7% | 15.4% |
| Range | 30.9% | 4.7% |
| Mean | 13.5% | 12.7% |
| Median | 10.9% | 12.6% |
| Interquartile 25% (IQ1) | 9.8% | 12.3% |
| Interquartile 75% (IQ3) | 13.0% | 13.1% |
| Interquartile Range (IQR) | 3.2% | 0.82% |
| Standard Deviation (Sample) | 7.2% | 0.77% |
| Standard Deviation (Population) | 7.1% | 0.77% |
Similar Demographics by Divorced or Separated
Demographics Similar to Immigrants from Egypt by Divorced or Separated
In terms of divorced or separated, the demographic groups most similar to Immigrants from Egypt are Soviet Union (11.1%, a difference of 0.090%), Immigrants from Greece (11.1%, a difference of 0.24%), Immigrants from Lebanon (11.1%, a difference of 0.30%), Immigrants from Japan (11.1%, a difference of 0.31%), and Bhutanese (11.2%, a difference of 0.36%).
| Demographics | Rating | Rank | Divorced or Separated |
| Tongans | 100.0 /100 | #32 | Exceptional 11.1% |
| Egyptians | 100.0 /100 | #33 | Exceptional 11.1% |
| Immigrants | Uzbekistan | 100.0 /100 | #34 | Exceptional 11.1% |
| Cambodians | 100.0 /100 | #35 | Exceptional 11.1% |
| Immigrants | Japan | 100.0 /100 | #36 | Exceptional 11.1% |
| Immigrants | Lebanon | 100.0 /100 | #37 | Exceptional 11.1% |
| Immigrants | Greece | 100.0 /100 | #38 | Exceptional 11.1% |
| Immigrants | Egypt | 100.0 /100 | #39 | Exceptional 11.1% |
| Soviet Union | 100.0 /100 | #40 | Exceptional 11.1% |
| Bhutanese | 100.0 /100 | #41 | Exceptional 11.2% |
| Chinese | 100.0 /100 | #42 | Exceptional 11.2% |
| Immigrants | Belarus | 100.0 /100 | #43 | Exceptional 11.2% |
| Immigrants | Western Asia | 100.0 /100 | #44 | Exceptional 11.2% |
| Turks | 100.0 /100 | #45 | Exceptional 11.2% |
| Laotians | 100.0 /100 | #46 | Exceptional 11.2% |
Demographics Similar to Whites/Caucasians by Divorced or Separated
In terms of divorced or separated, the demographic groups most similar to Whites/Caucasians are Immigrants from Senegal (12.6%, a difference of 0.010%), English (12.6%, a difference of 0.030%), Scottish (12.6%, a difference of 0.040%), Immigrants from Panama (12.6%, a difference of 0.050%), and Fijian (12.6%, a difference of 0.060%).
| Demographics | Rating | Rank | Divorced or Separated |
| Yuman | 0.6 /100 | #259 | Tragic 12.6% |
| Immigrants | Uruguay | 0.6 /100 | #260 | Tragic 12.6% |
| Immigrants | Dominica | 0.5 /100 | #261 | Tragic 12.6% |
| Basques | 0.5 /100 | #262 | Tragic 12.6% |
| Immigrants | Panama | 0.5 /100 | #263 | Tragic 12.6% |
| English | 0.5 /100 | #264 | Tragic 12.6% |
| Immigrants | Senegal | 0.5 /100 | #265 | Tragic 12.6% |
| Whites/Caucasians | 0.5 /100 | #266 | Tragic 12.6% |
| Scottish | 0.4 /100 | #267 | Tragic 12.6% |
| Fijians | 0.4 /100 | #268 | Tragic 12.6% |
| Immigrants | Liberia | 0.4 /100 | #269 | Tragic 12.6% |
| Ute | 0.4 /100 | #270 | Tragic 12.6% |
| Panamanians | 0.3 /100 | #271 | Tragic 12.7% |
| Immigrants | Middle Africa | 0.3 /100 | #272 | Tragic 12.7% |
| Immigrants | Micronesia | 0.3 /100 | #273 | Tragic 12.7% |