South American Indian vs White/Caucasian Divorced or Separated
COMPARE
South American Indian
White/Caucasian
Divorced or Separated
Divorced or Separated Comparison
South American Indians
Whites/Caucasians
11.8%
DIVORCED OR SEPARATED
92.1/ 100
METRIC RATING
126th/ 347
METRIC RANK
12.6%
DIVORCED OR SEPARATED
0.5/ 100
METRIC RATING
266th/ 347
METRIC RANK
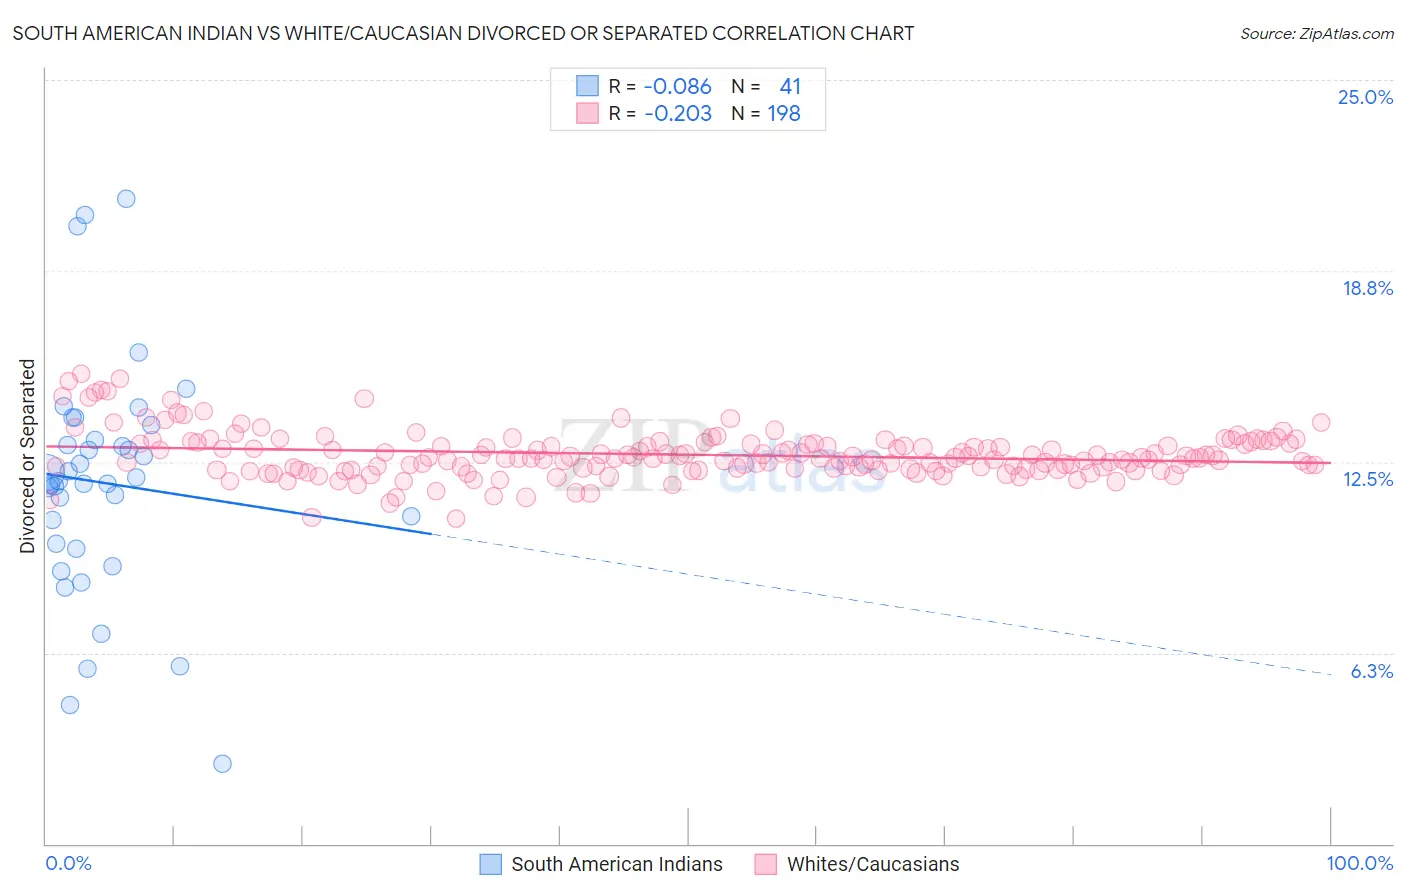
South American Indian vs White/Caucasian Divorced or Separated Correlation Chart
The statistical analysis conducted on geographies consisting of 164,560,857 people shows a slight negative correlation between the proportion of South American Indians and percentage of population currently divorced or separated in the United States with a correlation coefficient (R) of -0.086 and weighted average of 11.8%. Similarly, the statistical analysis conducted on geographies consisting of 582,391,050 people shows a weak negative correlation between the proportion of Whites/Caucasians and percentage of population currently divorced or separated in the United States with a correlation coefficient (R) of -0.203 and weighted average of 12.6%, a difference of 7.0%.
Divorced or Separated Correlation Summary
| Measurement | South American Indian | White/Caucasian |
| Minimum | 2.6% | 10.6% |
| Maximum | 21.1% | 15.4% |
| Range | 18.5% | 4.7% |
| Mean | 11.8% | 12.7% |
| Median | 11.9% | 12.6% |
| Interquartile 25% (IQ1) | 9.7% | 12.3% |
| Interquartile 75% (IQ3) | 13.4% | 13.1% |
| Interquartile Range (IQR) | 3.7% | 0.82% |
| Standard Deviation (Sample) | 3.8% | 0.77% |
| Standard Deviation (Population) | 3.8% | 0.77% |
Similar Demographics by Divorced or Separated
Demographics Similar to South American Indians by Divorced or Separated
In terms of divorced or separated, the demographic groups most similar to South American Indians are Ukrainian (11.8%, a difference of 0.020%), Ugandan (11.8%, a difference of 0.13%), Immigrants (11.8%, a difference of 0.21%), Menominee (11.8%, a difference of 0.22%), and Romanian (11.8%, a difference of 0.34%).
| Demographics | Rating | Rank | Divorced or Separated |
| Syrians | 95.1 /100 | #119 | Exceptional 11.7% |
| Iraqis | 94.6 /100 | #120 | Exceptional 11.8% |
| Romanians | 94.5 /100 | #121 | Exceptional 11.8% |
| Menominee | 93.8 /100 | #122 | Exceptional 11.8% |
| Immigrants | Immigrants | 93.7 /100 | #123 | Exceptional 11.8% |
| Ugandans | 93.1 /100 | #124 | Exceptional 11.8% |
| Ukrainians | 92.3 /100 | #125 | Exceptional 11.8% |
| South American Indians | 92.1 /100 | #126 | Exceptional 11.8% |
| South Africans | 88.9 /100 | #127 | Excellent 11.8% |
| Immigrants | Ecuador | 88.9 /100 | #128 | Excellent 11.8% |
| Immigrants | St. Vincent and the Grenadines | 88.4 /100 | #129 | Excellent 11.8% |
| Immigrants | Austria | 88.2 /100 | #130 | Excellent 11.8% |
| Immigrants | Cambodia | 88.2 /100 | #131 | Excellent 11.8% |
| Immigrants | Afghanistan | 87.9 /100 | #132 | Excellent 11.8% |
| New Zealanders | 87.5 /100 | #133 | Excellent 11.9% |
Demographics Similar to Whites/Caucasians by Divorced or Separated
In terms of divorced or separated, the demographic groups most similar to Whites/Caucasians are Immigrants from Senegal (12.6%, a difference of 0.010%), English (12.6%, a difference of 0.030%), Scottish (12.6%, a difference of 0.040%), Immigrants from Panama (12.6%, a difference of 0.050%), and Fijian (12.6%, a difference of 0.060%).
| Demographics | Rating | Rank | Divorced or Separated |
| Yuman | 0.6 /100 | #259 | Tragic 12.6% |
| Immigrants | Uruguay | 0.6 /100 | #260 | Tragic 12.6% |
| Immigrants | Dominica | 0.5 /100 | #261 | Tragic 12.6% |
| Basques | 0.5 /100 | #262 | Tragic 12.6% |
| Immigrants | Panama | 0.5 /100 | #263 | Tragic 12.6% |
| English | 0.5 /100 | #264 | Tragic 12.6% |
| Immigrants | Senegal | 0.5 /100 | #265 | Tragic 12.6% |
| Whites/Caucasians | 0.5 /100 | #266 | Tragic 12.6% |
| Scottish | 0.4 /100 | #267 | Tragic 12.6% |
| Fijians | 0.4 /100 | #268 | Tragic 12.6% |
| Immigrants | Liberia | 0.4 /100 | #269 | Tragic 12.6% |
| Ute | 0.4 /100 | #270 | Tragic 12.6% |
| Panamanians | 0.3 /100 | #271 | Tragic 12.7% |
| Immigrants | Middle Africa | 0.3 /100 | #272 | Tragic 12.7% |
| Immigrants | Micronesia | 0.3 /100 | #273 | Tragic 12.7% |