Sierra Leonean vs Immigrants from Thailand Divorced or Separated
COMPARE
Sierra Leonean
Immigrants from Thailand
Divorced or Separated
Divorced or Separated Comparison
Sierra Leoneans
Immigrants from Thailand
12.1%
DIVORCED OR SEPARATED
35.5/ 100
METRIC RATING
189th/ 347
METRIC RANK
12.1%
DIVORCED OR SEPARATED
32.5/ 100
METRIC RATING
193rd/ 347
METRIC RANK
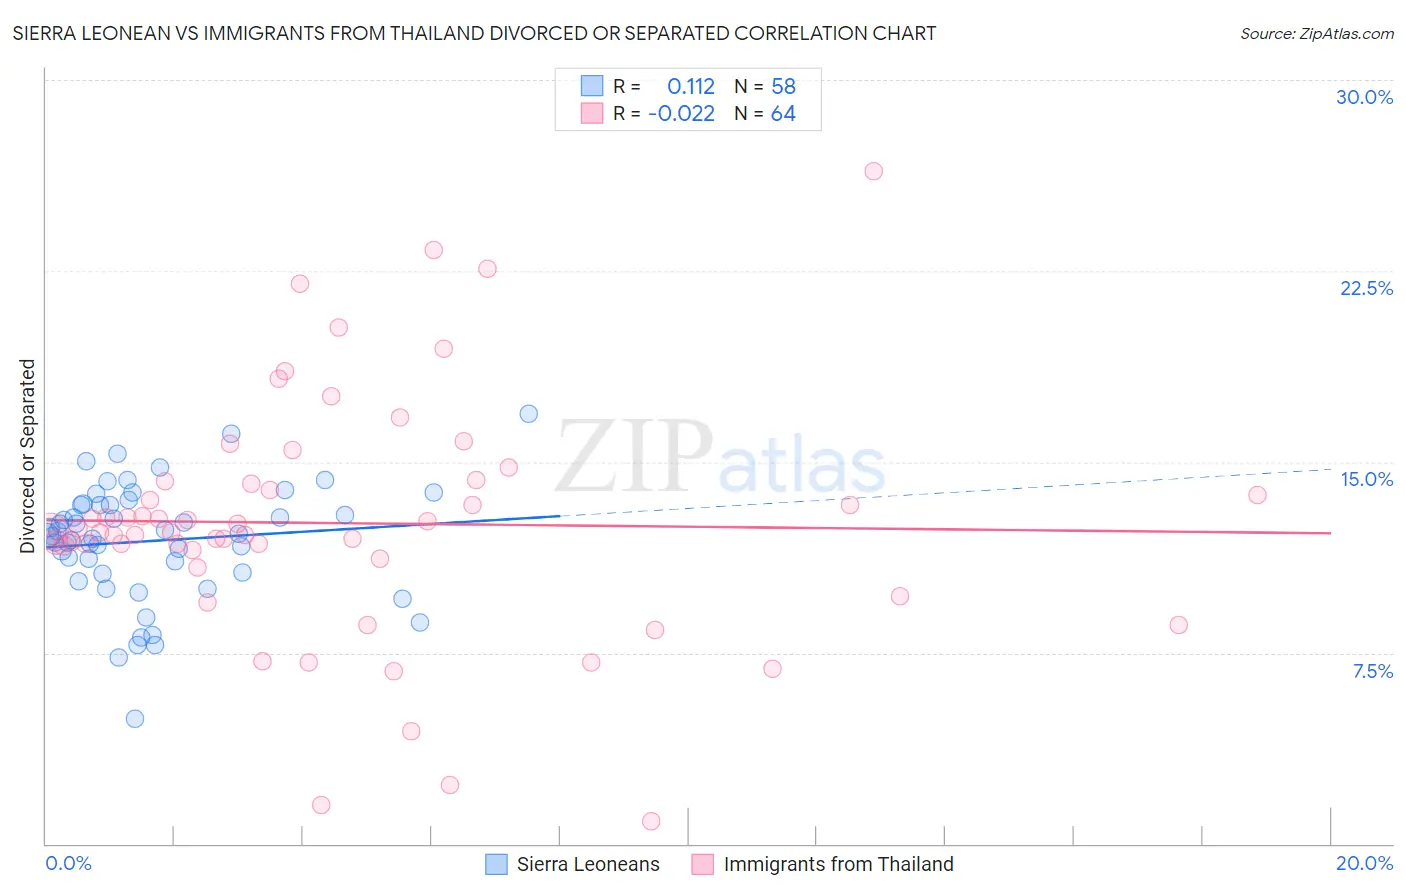
Sierra Leonean vs Immigrants from Thailand Divorced or Separated Correlation Chart
The statistical analysis conducted on geographies consisting of 83,352,562 people shows a poor positive correlation between the proportion of Sierra Leoneans and percentage of population currently divorced or separated in the United States with a correlation coefficient (R) of 0.112 and weighted average of 12.1%. Similarly, the statistical analysis conducted on geographies consisting of 316,951,219 people shows no correlation between the proportion of Immigrants from Thailand and percentage of population currently divorced or separated in the United States with a correlation coefficient (R) of -0.022 and weighted average of 12.1%, a difference of 0.12%.
Divorced or Separated Correlation Summary
| Measurement | Sierra Leonean | Immigrants from Thailand |
| Minimum | 4.9% | 0.90% |
| Maximum | 16.9% | 26.4% |
| Range | 12.0% | 25.5% |
| Mean | 11.9% | 12.6% |
| Median | 12.2% | 12.3% |
| Interquartile 25% (IQ1) | 10.6% | 11.4% |
| Interquartile 75% (IQ3) | 13.3% | 14.2% |
| Interquartile Range (IQR) | 2.7% | 2.8% |
| Standard Deviation (Sample) | 2.3% | 4.8% |
| Standard Deviation (Population) | 2.3% | 4.7% |
Demographics Similar to Sierra Leoneans and Immigrants from Thailand by Divorced or Separated
In terms of divorced or separated, the demographic groups most similar to Sierra Leoneans are Moroccan (12.1%, a difference of 0.030%), Swedish (12.1%, a difference of 0.040%), Belizean (12.1%, a difference of 0.080%), Immigrants from Belize (12.1%, a difference of 0.080%), and Norwegian (12.1%, a difference of 0.090%). Similarly, the demographic groups most similar to Immigrants from Thailand are Immigrants from Eritrea (12.1%, a difference of 0.020%), Norwegian (12.1%, a difference of 0.030%), Immigrants from England (12.1%, a difference of 0.040%), Swedish (12.1%, a difference of 0.070%), and Immigrants from Burma/Myanmar (12.1%, a difference of 0.080%).
| Demographics | Rating | Rank | Divorced or Separated |
| Immigrants | Canada | 44.0 /100 | #181 | Average 12.1% |
| Immigrants | Ethiopia | 43.1 /100 | #182 | Average 12.1% |
| Immigrants | Central America | 42.9 /100 | #183 | Average 12.1% |
| Immigrants | North America | 41.1 /100 | #184 | Average 12.1% |
| Immigrants | Nigeria | 40.5 /100 | #185 | Average 12.1% |
| Immigrants | Chile | 39.0 /100 | #186 | Fair 12.1% |
| Belizeans | 37.7 /100 | #187 | Fair 12.1% |
| Immigrants | Belize | 37.6 /100 | #188 | Fair 12.1% |
| Sierra Leoneans | 35.5 /100 | #189 | Fair 12.1% |
| Moroccans | 34.8 /100 | #190 | Fair 12.1% |
| Swedes | 34.4 /100 | #191 | Fair 12.1% |
| Norwegians | 33.2 /100 | #192 | Fair 12.1% |
| Immigrants | Thailand | 32.5 /100 | #193 | Fair 12.1% |
| Immigrants | Eritrea | 31.9 /100 | #194 | Fair 12.1% |
| Immigrants | England | 31.4 /100 | #195 | Fair 12.1% |
| Immigrants | Burma/Myanmar | 30.4 /100 | #196 | Fair 12.1% |
| Immigrants | Africa | 30.3 /100 | #197 | Fair 12.1% |
| Nigerians | 30.1 /100 | #198 | Fair 12.1% |
| Central Americans | 29.4 /100 | #199 | Fair 12.1% |
| South Americans | 28.6 /100 | #200 | Fair 12.2% |
| Guatemalans | 26.9 /100 | #201 | Fair 12.2% |