Puget Sound Salish vs White/Caucasian Divorced or Separated
COMPARE
Puget Sound Salish
White/Caucasian
Divorced or Separated
Divorced or Separated Comparison
Puget Sound Salish
Whites/Caucasians
13.4%
DIVORCED OR SEPARATED
0.0/ 100
METRIC RATING
319th/ 347
METRIC RANK
12.6%
DIVORCED OR SEPARATED
0.5/ 100
METRIC RATING
266th/ 347
METRIC RANK
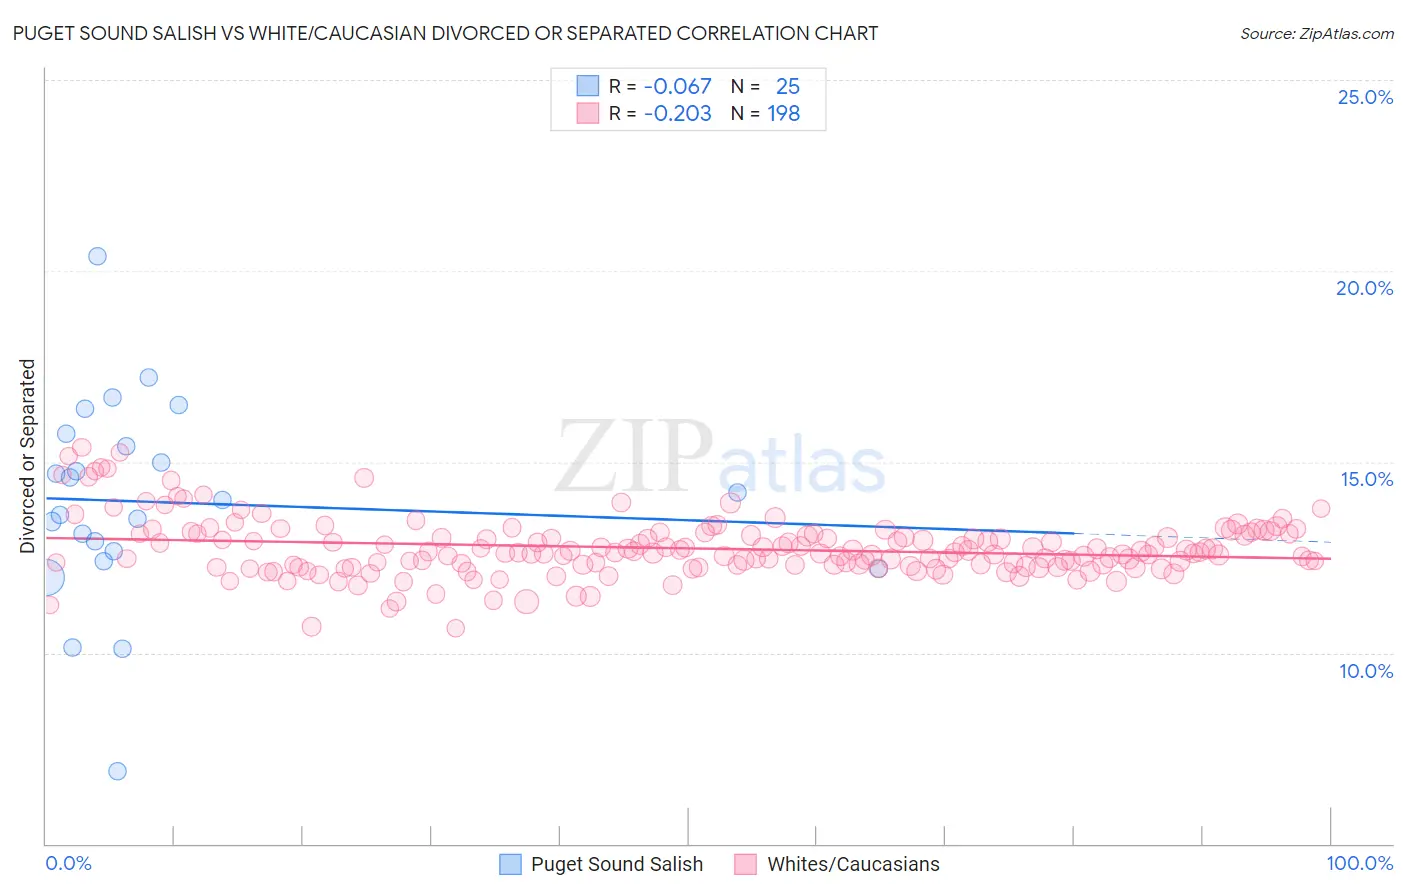
Puget Sound Salish vs White/Caucasian Divorced or Separated Correlation Chart
The statistical analysis conducted on geographies consisting of 46,155,746 people shows a slight negative correlation between the proportion of Puget Sound Salish and percentage of population currently divorced or separated in the United States with a correlation coefficient (R) of -0.067 and weighted average of 13.4%. Similarly, the statistical analysis conducted on geographies consisting of 582,391,050 people shows a weak negative correlation between the proportion of Whites/Caucasians and percentage of population currently divorced or separated in the United States with a correlation coefficient (R) of -0.203 and weighted average of 12.6%, a difference of 5.8%.
Divorced or Separated Correlation Summary
| Measurement | Puget Sound Salish | White/Caucasian |
| Minimum | 6.9% | 10.6% |
| Maximum | 20.4% | 15.4% |
| Range | 13.5% | 4.7% |
| Mean | 13.9% | 12.7% |
| Median | 14.0% | 12.6% |
| Interquartile 25% (IQ1) | 12.5% | 12.3% |
| Interquartile 75% (IQ3) | 15.6% | 13.1% |
| Interquartile Range (IQR) | 3.0% | 0.82% |
| Standard Deviation (Sample) | 2.7% | 0.77% |
| Standard Deviation (Population) | 2.6% | 0.77% |
Similar Demographics by Divorced or Separated
Demographics Similar to Puget Sound Salish by Divorced or Separated
In terms of divorced or separated, the demographic groups most similar to Puget Sound Salish are Cree (13.4%, a difference of 0.040%), Haitian (13.3%, a difference of 0.060%), Cajun (13.4%, a difference of 0.060%), Tsimshian (13.3%, a difference of 0.080%), and Spanish American (13.3%, a difference of 0.12%).
| Demographics | Rating | Rank | Divorced or Separated |
| Blackfeet | 0.0 /100 | #312 | Tragic 13.3% |
| Immigrants | Nicaragua | 0.0 /100 | #313 | Tragic 13.3% |
| Yaqui | 0.0 /100 | #314 | Tragic 13.3% |
| Spanish Americans | 0.0 /100 | #315 | Tragic 13.3% |
| Tsimshian | 0.0 /100 | #316 | Tragic 13.3% |
| Haitians | 0.0 /100 | #317 | Tragic 13.3% |
| Cree | 0.0 /100 | #318 | Tragic 13.4% |
| Puget Sound Salish | 0.0 /100 | #319 | Tragic 13.4% |
| Cajuns | 0.0 /100 | #320 | Tragic 13.4% |
| Cheyenne | 0.0 /100 | #321 | Tragic 13.4% |
| Immigrants | Haiti | 0.0 /100 | #322 | Tragic 13.4% |
| U.S. Virgin Islanders | 0.0 /100 | #323 | Tragic 13.4% |
| Osage | 0.0 /100 | #324 | Tragic 13.4% |
| Potawatomi | 0.0 /100 | #325 | Tragic 13.5% |
| Immigrants | Congo | 0.0 /100 | #326 | Tragic 13.5% |
Demographics Similar to Whites/Caucasians by Divorced or Separated
In terms of divorced or separated, the demographic groups most similar to Whites/Caucasians are Immigrants from Senegal (12.6%, a difference of 0.010%), English (12.6%, a difference of 0.030%), Scottish (12.6%, a difference of 0.040%), Immigrants from Panama (12.6%, a difference of 0.050%), and Fijian (12.6%, a difference of 0.060%).
| Demographics | Rating | Rank | Divorced or Separated |
| Yuman | 0.6 /100 | #259 | Tragic 12.6% |
| Immigrants | Uruguay | 0.6 /100 | #260 | Tragic 12.6% |
| Immigrants | Dominica | 0.5 /100 | #261 | Tragic 12.6% |
| Basques | 0.5 /100 | #262 | Tragic 12.6% |
| Immigrants | Panama | 0.5 /100 | #263 | Tragic 12.6% |
| English | 0.5 /100 | #264 | Tragic 12.6% |
| Immigrants | Senegal | 0.5 /100 | #265 | Tragic 12.6% |
| Whites/Caucasians | 0.5 /100 | #266 | Tragic 12.6% |
| Scottish | 0.4 /100 | #267 | Tragic 12.6% |
| Fijians | 0.4 /100 | #268 | Tragic 12.6% |
| Immigrants | Liberia | 0.4 /100 | #269 | Tragic 12.6% |
| Ute | 0.4 /100 | #270 | Tragic 12.6% |
| Panamanians | 0.3 /100 | #271 | Tragic 12.7% |
| Immigrants | Middle Africa | 0.3 /100 | #272 | Tragic 12.7% |
| Immigrants | Micronesia | 0.3 /100 | #273 | Tragic 12.7% |