Shoshone vs Scotch-Irish Single Father Households
COMPARE
Shoshone
Scotch-Irish
Single Father Households
Single Father Households Comparison
Shoshone
Scotch-Irish
2.6%
SINGLE FATHER HOUSEHOLDS
0.1/ 100
METRIC RATING
277th/ 347
METRIC RANK
2.3%
SINGLE FATHER HOUSEHOLDS
69.4/ 100
METRIC RATING
165th/ 347
METRIC RANK
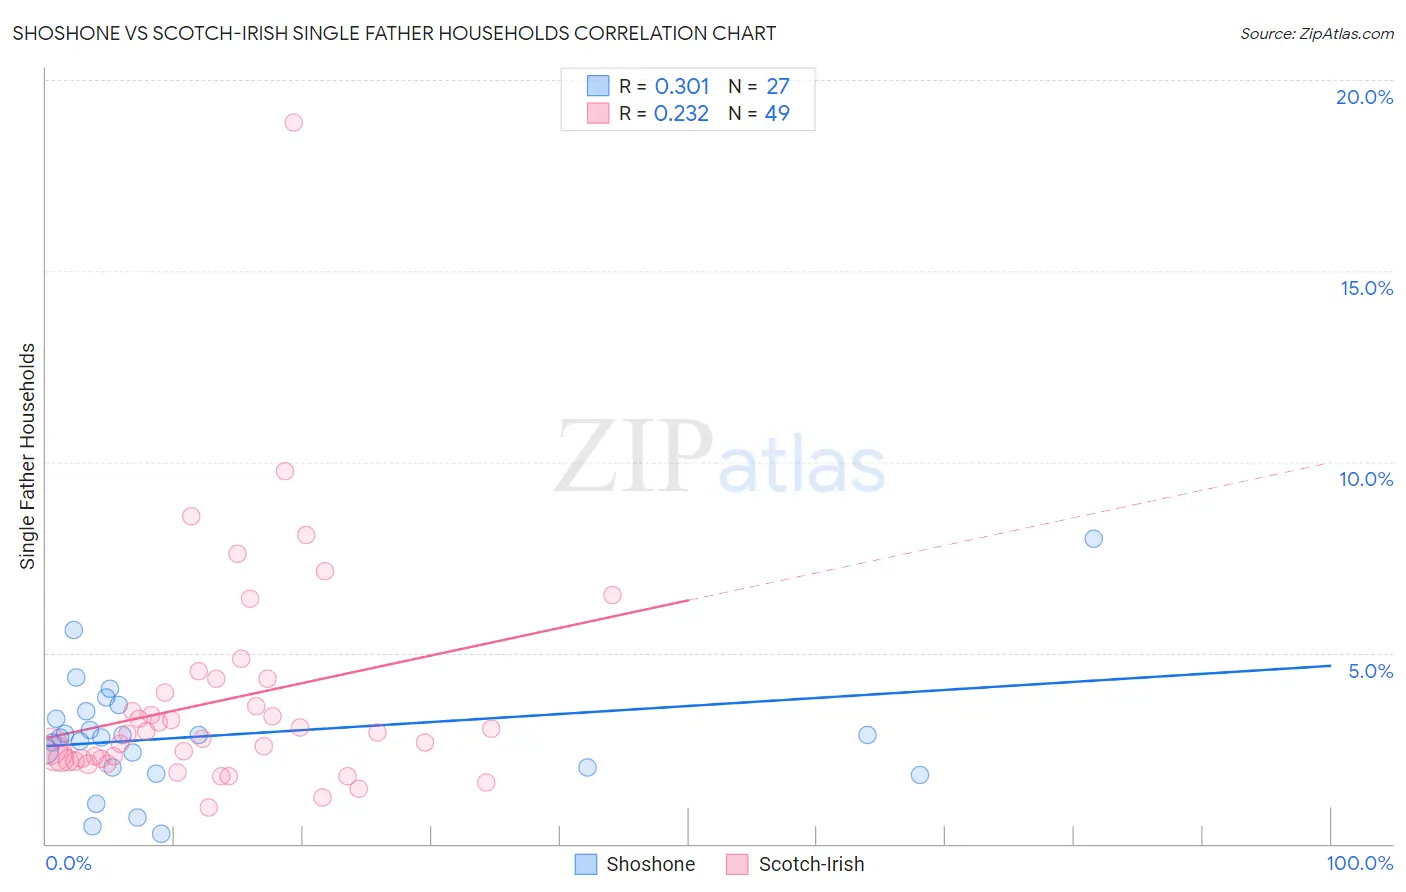
Shoshone vs Scotch-Irish Single Father Households Correlation Chart
The statistical analysis conducted on geographies consisting of 66,467,409 people shows a mild positive correlation between the proportion of Shoshone and percentage of single father households in the United States with a correlation coefficient (R) of 0.301 and weighted average of 2.6%. Similarly, the statistical analysis conducted on geographies consisting of 535,957,408 people shows a weak positive correlation between the proportion of Scotch-Irish and percentage of single father households in the United States with a correlation coefficient (R) of 0.232 and weighted average of 2.3%, a difference of 13.8%.
Single Father Households Correlation Summary
| Measurement | Shoshone | Scotch-Irish |
| Minimum | 0.27% | 0.96% |
| Maximum | 8.0% | 18.9% |
| Range | 7.7% | 17.9% |
| Mean | 2.8% | 3.7% |
| Median | 2.8% | 2.9% |
| Interquartile 25% (IQ1) | 2.0% | 2.2% |
| Interquartile 75% (IQ3) | 3.5% | 4.1% |
| Interquartile Range (IQR) | 1.5% | 1.9% |
| Standard Deviation (Sample) | 1.6% | 3.0% |
| Standard Deviation (Population) | 1.5% | 3.0% |
Similar Demographics by Single Father Households
Demographics Similar to Shoshone by Single Father Households
In terms of single father households, the demographic groups most similar to Shoshone are Immigrants from Haiti (2.6%, a difference of 0.030%), Cherokee (2.6%, a difference of 0.050%), Samoan (2.6%, a difference of 0.090%), Immigrants from Dominican Republic (2.6%, a difference of 0.24%), and Immigrants from Portugal (2.6%, a difference of 0.64%).
| Demographics | Rating | Rank | Single Father Households |
| Seminole | 0.3 /100 | #270 | Tragic 2.6% |
| Creek | 0.2 /100 | #271 | Tragic 2.6% |
| Belizeans | 0.2 /100 | #272 | Tragic 2.6% |
| Iroquois | 0.2 /100 | #273 | Tragic 2.6% |
| Puerto Ricans | 0.2 /100 | #274 | Tragic 2.6% |
| Immigrants | Dominican Republic | 0.2 /100 | #275 | Tragic 2.6% |
| Immigrants | Haiti | 0.1 /100 | #276 | Tragic 2.6% |
| Shoshone | 0.1 /100 | #277 | Tragic 2.6% |
| Cherokee | 0.1 /100 | #278 | Tragic 2.6% |
| Samoans | 0.1 /100 | #279 | Tragic 2.6% |
| Immigrants | Portugal | 0.1 /100 | #280 | Tragic 2.6% |
| Nicaraguans | 0.1 /100 | #281 | Tragic 2.6% |
| Dutch West Indians | 0.1 /100 | #282 | Tragic 2.6% |
| Immigrants | Nicaragua | 0.1 /100 | #283 | Tragic 2.7% |
| Hawaiians | 0.1 /100 | #284 | Tragic 2.7% |
Demographics Similar to Scotch-Irish by Single Father Households
In terms of single father households, the demographic groups most similar to Scotch-Irish are English (2.3%, a difference of 0.070%), Pakistani (2.3%, a difference of 0.10%), Irish (2.3%, a difference of 0.24%), Scottish (2.3%, a difference of 0.31%), and Swiss (2.3%, a difference of 0.35%).
| Demographics | Rating | Rank | Single Father Households |
| Immigrants | Senegal | 79.4 /100 | #158 | Good 2.3% |
| Immigrants | West Indies | 77.9 /100 | #159 | Good 2.3% |
| Immigrants | Bolivia | 76.3 /100 | #160 | Good 2.3% |
| Swiss | 73.2 /100 | #161 | Good 2.3% |
| Scottish | 72.8 /100 | #162 | Good 2.3% |
| Irish | 72.1 /100 | #163 | Good 2.3% |
| Pakistanis | 70.6 /100 | #164 | Good 2.3% |
| Scotch-Irish | 69.4 /100 | #165 | Good 2.3% |
| English | 68.6 /100 | #166 | Good 2.3% |
| South Americans | 64.3 /100 | #167 | Good 2.3% |
| Icelanders | 63.1 /100 | #168 | Good 2.3% |
| Czechs | 62.5 /100 | #169 | Good 2.3% |
| Ugandans | 62.2 /100 | #170 | Good 2.3% |
| Swedes | 61.6 /100 | #171 | Good 2.3% |
| Czechoslovakians | 58.9 /100 | #172 | Average 2.3% |