Immigrants from Colombia vs Scotch-Irish Single Father Households
COMPARE
Immigrants from Colombia
Scotch-Irish
Single Father Households
Single Father Households Comparison
Immigrants from Colombia
Scotch-Irish
2.4%
SINGLE FATHER HOUSEHOLDS
34.0/ 100
METRIC RATING
187th/ 347
METRIC RANK
2.3%
SINGLE FATHER HOUSEHOLDS
69.4/ 100
METRIC RATING
165th/ 347
METRIC RANK
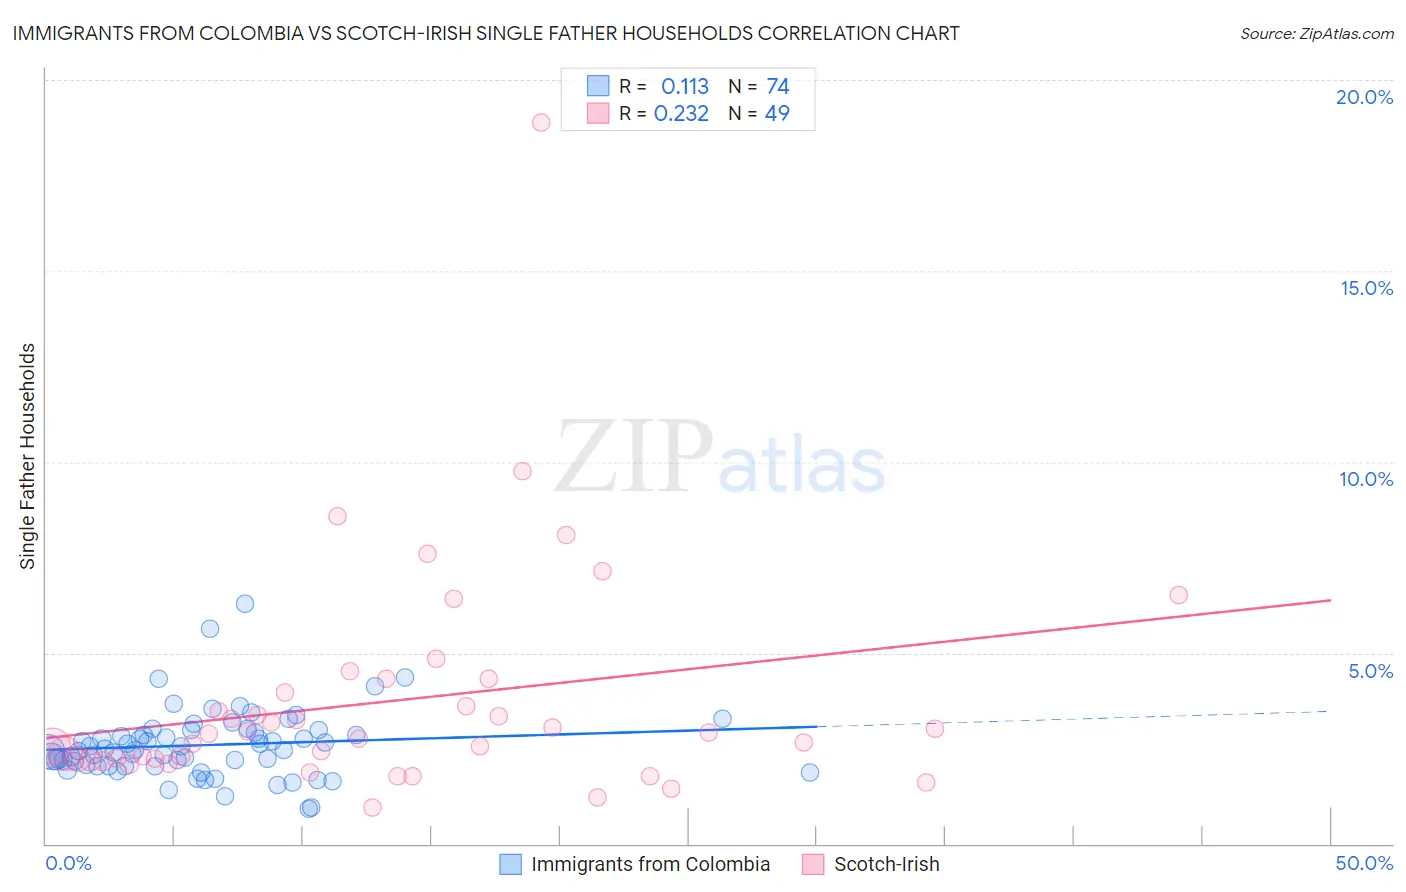
Immigrants from Colombia vs Scotch-Irish Single Father Households Correlation Chart
The statistical analysis conducted on geographies consisting of 375,877,242 people shows a poor positive correlation between the proportion of Immigrants from Colombia and percentage of single father households in the United States with a correlation coefficient (R) of 0.113 and weighted average of 2.4%. Similarly, the statistical analysis conducted on geographies consisting of 535,957,408 people shows a weak positive correlation between the proportion of Scotch-Irish and percentage of single father households in the United States with a correlation coefficient (R) of 0.232 and weighted average of 2.3%, a difference of 2.8%.
Single Father Households Correlation Summary
| Measurement | Immigrants from Colombia | Scotch-Irish |
| Minimum | 0.91% | 0.96% |
| Maximum | 6.3% | 18.9% |
| Range | 5.4% | 17.9% |
| Mean | 2.6% | 3.7% |
| Median | 2.4% | 2.9% |
| Interquartile 25% (IQ1) | 2.0% | 2.2% |
| Interquartile 75% (IQ3) | 2.9% | 4.1% |
| Interquartile Range (IQR) | 0.88% | 1.9% |
| Standard Deviation (Sample) | 0.90% | 3.0% |
| Standard Deviation (Population) | 0.89% | 3.0% |
Similar Demographics by Single Father Households
Demographics Similar to Immigrants from Colombia by Single Father Households
In terms of single father households, the demographic groups most similar to Immigrants from Colombia are Hmong (2.4%, a difference of 0.080%), U.S. Virgin Islander (2.4%, a difference of 0.18%), French (2.4%, a difference of 0.19%), Immigrants from Africa (2.4%, a difference of 0.33%), and Immigrants from Sudan (2.4%, a difference of 0.35%).
| Demographics | Rating | Rank | Single Father Households |
| Yugoslavians | 43.9 /100 | #180 | Average 2.3% |
| Jamaicans | 43.5 /100 | #181 | Average 2.3% |
| Belgians | 43.3 /100 | #182 | Average 2.3% |
| Immigrants | Panama | 41.8 /100 | #183 | Average 2.4% |
| Sri Lankans | 41.8 /100 | #184 | Average 2.4% |
| Nigerians | 41.0 /100 | #185 | Average 2.4% |
| Immigrants | Bosnia and Herzegovina | 40.4 /100 | #186 | Average 2.4% |
| Immigrants | Colombia | 34.0 /100 | #187 | Fair 2.4% |
| Hmong | 33.0 /100 | #188 | Fair 2.4% |
| U.S. Virgin Islanders | 31.8 /100 | #189 | Fair 2.4% |
| French | 31.7 /100 | #190 | Fair 2.4% |
| Immigrants | Africa | 30.0 /100 | #191 | Fair 2.4% |
| Immigrants | Sudan | 29.8 /100 | #192 | Fair 2.4% |
| Uruguayans | 29.7 /100 | #193 | Fair 2.4% |
| Panamanians | 29.6 /100 | #194 | Fair 2.4% |
Demographics Similar to Scotch-Irish by Single Father Households
In terms of single father households, the demographic groups most similar to Scotch-Irish are English (2.3%, a difference of 0.070%), Pakistani (2.3%, a difference of 0.10%), Irish (2.3%, a difference of 0.24%), Scottish (2.3%, a difference of 0.31%), and Swiss (2.3%, a difference of 0.35%).
| Demographics | Rating | Rank | Single Father Households |
| Immigrants | Senegal | 79.4 /100 | #158 | Good 2.3% |
| Immigrants | West Indies | 77.9 /100 | #159 | Good 2.3% |
| Immigrants | Bolivia | 76.3 /100 | #160 | Good 2.3% |
| Swiss | 73.2 /100 | #161 | Good 2.3% |
| Scottish | 72.8 /100 | #162 | Good 2.3% |
| Irish | 72.1 /100 | #163 | Good 2.3% |
| Pakistanis | 70.6 /100 | #164 | Good 2.3% |
| Scotch-Irish | 69.4 /100 | #165 | Good 2.3% |
| English | 68.6 /100 | #166 | Good 2.3% |
| South Americans | 64.3 /100 | #167 | Good 2.3% |
| Icelanders | 63.1 /100 | #168 | Good 2.3% |
| Czechs | 62.5 /100 | #169 | Good 2.3% |
| Ugandans | 62.2 /100 | #170 | Good 2.3% |
| Swedes | 61.6 /100 | #171 | Good 2.3% |
| Czechoslovakians | 58.9 /100 | #172 | Average 2.3% |