Shoshone vs Kiowa Single Father Households
COMPARE
Shoshone
Kiowa
Single Father Households
Single Father Households Comparison
Shoshone
Kiowa
2.6%
SINGLE FATHER HOUSEHOLDS
0.1/ 100
METRIC RATING
277th/ 347
METRIC RANK
2.8%
SINGLE FATHER HOUSEHOLDS
0.0/ 100
METRIC RATING
300th/ 347
METRIC RANK
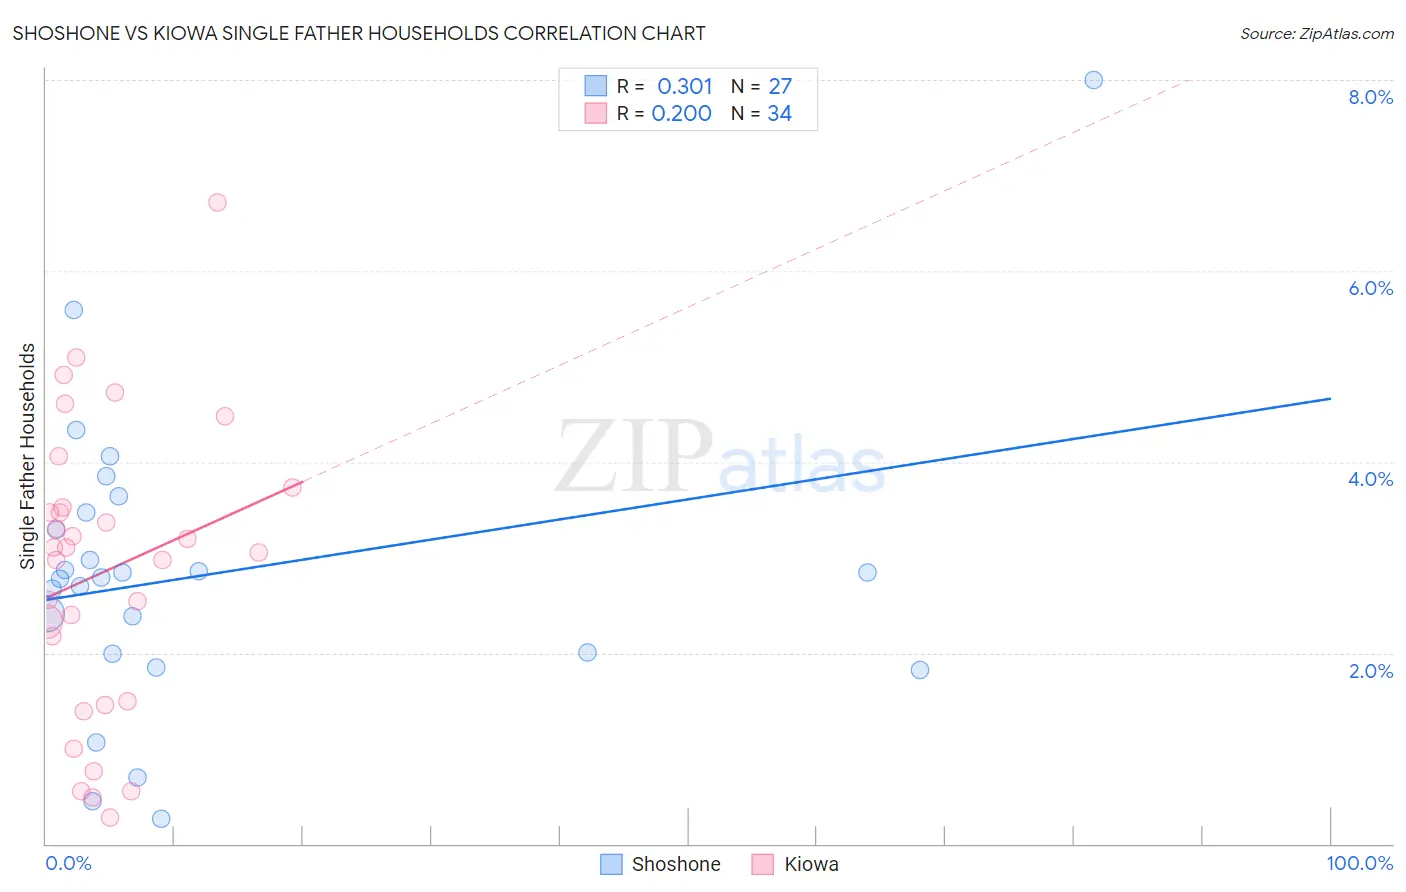
Shoshone vs Kiowa Single Father Households Correlation Chart
The statistical analysis conducted on geographies consisting of 66,467,409 people shows a mild positive correlation between the proportion of Shoshone and percentage of single father households in the United States with a correlation coefficient (R) of 0.301 and weighted average of 2.6%. Similarly, the statistical analysis conducted on geographies consisting of 56,039,243 people shows a weak positive correlation between the proportion of Kiowa and percentage of single father households in the United States with a correlation coefficient (R) of 0.200 and weighted average of 2.8%, a difference of 6.4%.
Single Father Households Correlation Summary
| Measurement | Shoshone | Kiowa |
| Minimum | 0.27% | 0.27% |
| Maximum | 8.0% | 6.7% |
| Range | 7.7% | 6.4% |
| Mean | 2.8% | 2.9% |
| Median | 2.8% | 3.1% |
| Interquartile 25% (IQ1) | 2.0% | 1.5% |
| Interquartile 75% (IQ3) | 3.5% | 3.5% |
| Interquartile Range (IQR) | 1.5% | 2.0% |
| Standard Deviation (Sample) | 1.6% | 1.5% |
| Standard Deviation (Population) | 1.5% | 1.5% |
Similar Demographics by Single Father Households
Demographics Similar to Shoshone by Single Father Households
In terms of single father households, the demographic groups most similar to Shoshone are Immigrants from Haiti (2.6%, a difference of 0.030%), Cherokee (2.6%, a difference of 0.050%), Samoan (2.6%, a difference of 0.090%), Immigrants from Dominican Republic (2.6%, a difference of 0.24%), and Immigrants from Portugal (2.6%, a difference of 0.64%).
| Demographics | Rating | Rank | Single Father Households |
| Seminole | 0.3 /100 | #270 | Tragic 2.6% |
| Creek | 0.2 /100 | #271 | Tragic 2.6% |
| Belizeans | 0.2 /100 | #272 | Tragic 2.6% |
| Iroquois | 0.2 /100 | #273 | Tragic 2.6% |
| Puerto Ricans | 0.2 /100 | #274 | Tragic 2.6% |
| Immigrants | Dominican Republic | 0.2 /100 | #275 | Tragic 2.6% |
| Immigrants | Haiti | 0.1 /100 | #276 | Tragic 2.6% |
| Shoshone | 0.1 /100 | #277 | Tragic 2.6% |
| Cherokee | 0.1 /100 | #278 | Tragic 2.6% |
| Samoans | 0.1 /100 | #279 | Tragic 2.6% |
| Immigrants | Portugal | 0.1 /100 | #280 | Tragic 2.6% |
| Nicaraguans | 0.1 /100 | #281 | Tragic 2.6% |
| Dutch West Indians | 0.1 /100 | #282 | Tragic 2.6% |
| Immigrants | Nicaragua | 0.1 /100 | #283 | Tragic 2.7% |
| Hawaiians | 0.1 /100 | #284 | Tragic 2.7% |
Demographics Similar to Kiowa by Single Father Households
In terms of single father households, the demographic groups most similar to Kiowa are Immigrants from Latin America (2.8%, a difference of 0.050%), Lumbee (2.8%, a difference of 0.40%), Spanish American (2.8%, a difference of 0.58%), Immigrants from Honduras (2.8%, a difference of 0.60%), and Cree (2.8%, a difference of 0.77%).
| Demographics | Rating | Rank | Single Father Households |
| Immigrants | Fiji | 0.0 /100 | #293 | Tragic 2.7% |
| Malaysians | 0.0 /100 | #294 | Tragic 2.7% |
| Chickasaw | 0.0 /100 | #295 | Tragic 2.8% |
| Japanese | 0.0 /100 | #296 | Tragic 2.8% |
| Hondurans | 0.0 /100 | #297 | Tragic 2.8% |
| Cree | 0.0 /100 | #298 | Tragic 2.8% |
| Lumbee | 0.0 /100 | #299 | Tragic 2.8% |
| Kiowa | 0.0 /100 | #300 | Tragic 2.8% |
| Immigrants | Latin America | 0.0 /100 | #301 | Tragic 2.8% |
| Spanish Americans | 0.0 /100 | #302 | Tragic 2.8% |
| Immigrants | Honduras | 0.0 /100 | #303 | Tragic 2.8% |
| Mexican American Indians | 0.0 /100 | #304 | Tragic 2.8% |
| Hispanics or Latinos | 0.0 /100 | #305 | Tragic 2.8% |
| Immigrants | Azores | 0.0 /100 | #306 | Tragic 2.8% |
| Hopi | 0.0 /100 | #307 | Tragic 2.8% |